An improving earnings backdrop would help alleviate some of the pressure on valuations. Some early evidence of that can already be seen when looking at the median P/E ratio for the S&P 500. This indicator has already started to come down off of its recent peak. A further acceleration in earnings growth could help push it back to its long-term average level. Of particular concern right now are pockets of extreme valuation in some of the thought-to-be defensive areas of the market (like the low-volatility and high-dividend themes). These areas, which are particularly sensitive to rising interest rates, trade at historically expensive levels. Valuations are best thought of as indicators of risk, and this suggests that many investors may be underestimating the risk in these crowded trades.
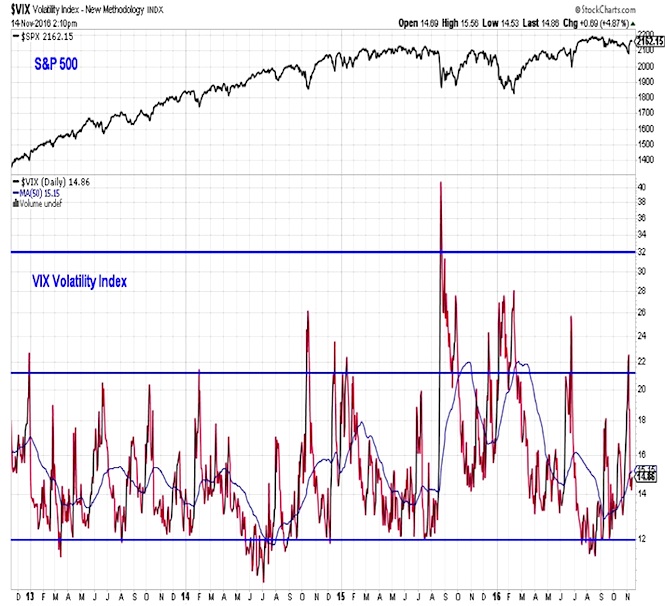
Investor sentiment has turned bullish. Optimism had become excessive in the wake of the rally to new stock market highs this summer. Leading up to the presidential election, however, optimism began to wane but pessimism was still hard to find. This allowed us to move sentiment from bearish to neutral, offsetting the deterioration seen in the broad market (more on that below). While outright pessimism has not been widespread when looking at just the weekly sentiment surveys, options data indicated a spike in fear ahead of the November elections. The VIX Volatility Index (INDEXCBOE:VIX) moved to its highest level since July and demand for protective puts soared. It appears the pessimism at least briefly reached truly excessive levels. Going forward, increasing optimism is a bullish tailwind for stock up to the point that it becomes excessive (which at this time of year may be a higher threshold than normal).
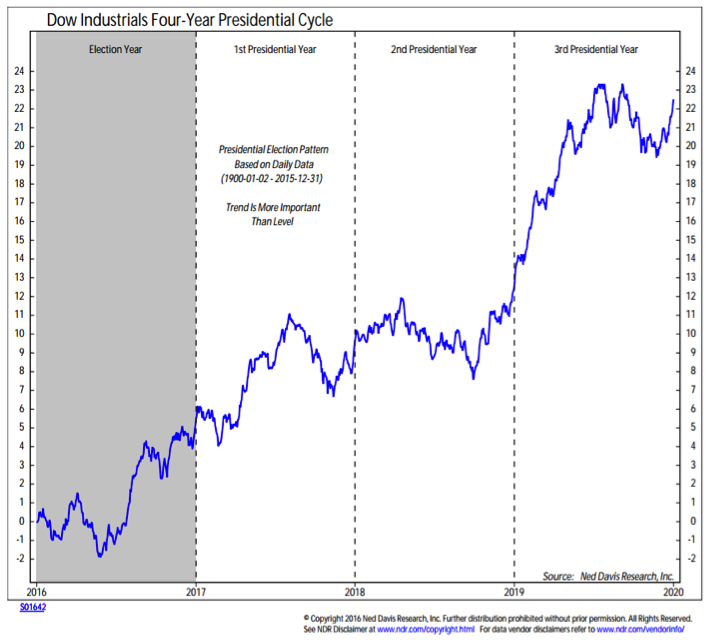
Seasonal Patterns/Trends are now bullish. Uncertainty over the election outcome is now a thing of the past, and history suggests that stocks could be poised to work higher, not only into year-end, but well-into 2017. The first year of a president’s term tends to have a reputation for lackluster stock market returns. A closer look at the pattern shows that stocks actually do well in the first half of the the first year, before settingly into a trading range that pushes toward the mid-term elections. This could be particularly true in the current example, as unified control of both Congress and the White House is expected to bring more fiscal stimulus than is typically seen early in the presidential cycle.
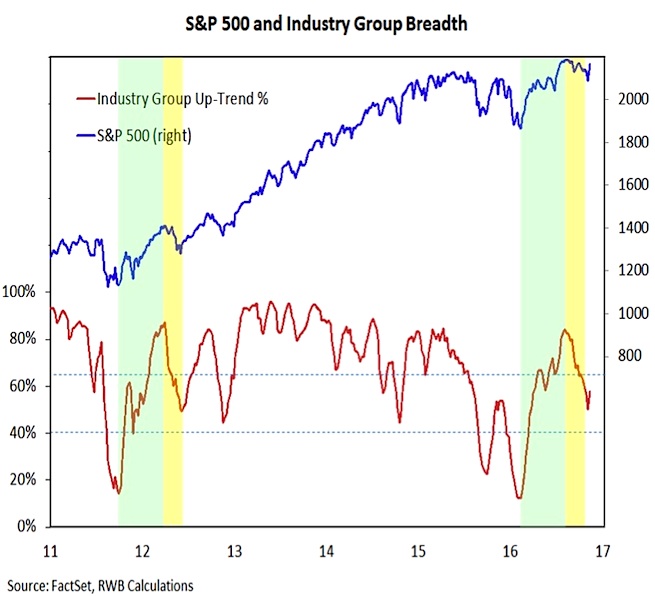
Broad market trends are neutral. The surge in breadth off of the early 2016 lows allowed us to upgrade breadth to bullish earlier this year. The trading range environment that characterized the late-summer action on the stock market, however, was accompanied by deteriorating breadth trends. Our industry group trend indicator dropped from showing more than 80% of groups in up-trends to just 50% of groups in up-trends. While this indicator has bounced off of that level, it is too early to have conviction that the broad market has gotten back in gear. There are hopeful signs (like seeing the most stocks on the NASDAQ making new 52-week highs in over a decade), but the overall message from the breadth indicators remains muddled, and so we are keeping our assessment of the broad market at neutral.
What To Do Now:
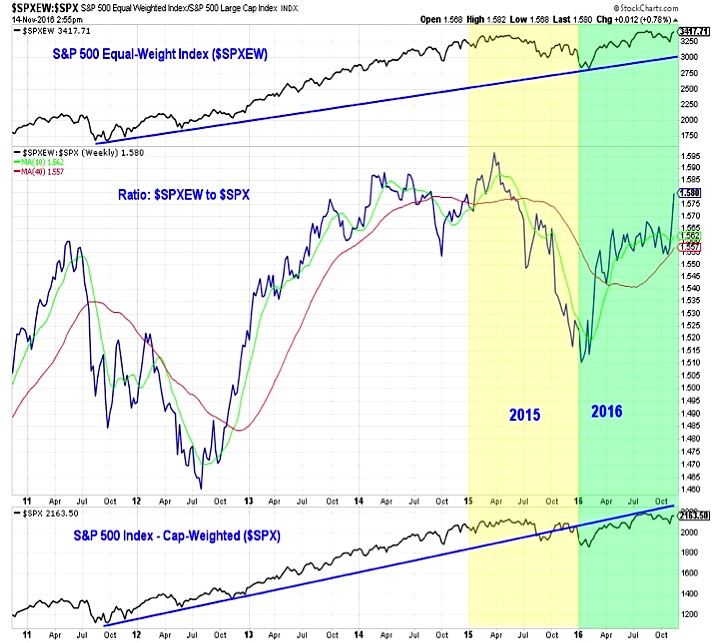
While breadth has not yet given an all clear signal, we are seeing a resumption of leadership from small-cap stocks (from the perspective of large-cap stocks, equal-weight indexes are again outperforming cap-weighted indexes). Where available, investors may want to tilt toward small- and mid-cap stocks. Small-caps stocks have lead the rally to new highs, and seasonal trends for small-caps are particularly bullish right now.
From a geographic perspective, U.S. leadership is re-asserting itself, especially from the perspective of U.S.-based investors.
Emerging markets have been particularly hard hit in the wake of the presidential election. Trends, however, favor continued emerging market leadership relative to developed markets.
While the near-term rise in bond yields may have gotten ahead of itself, this move is in the direction of the emerging trend. Given this, with fixed income exposure, we would prefer taking credit risk over interest rate risk.
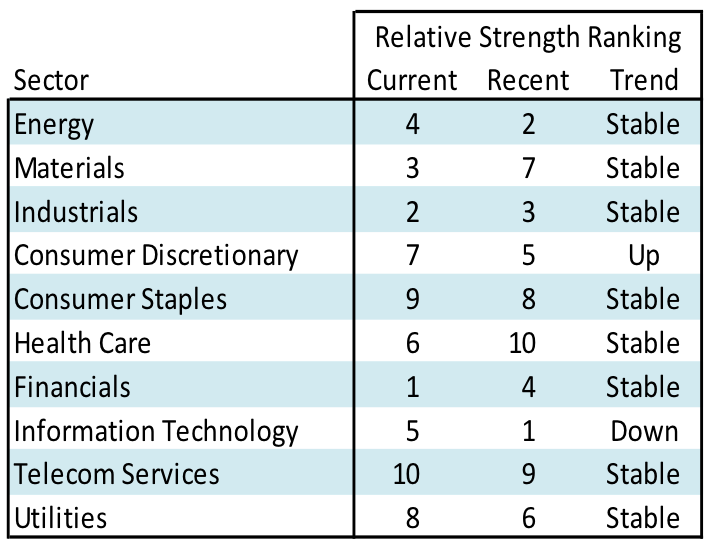
Sector-level relative strength leadership favors relatively under-owned cyclical exposure (like Industrials and Financials) over relatively crowded (and expensive) defensive exposure (like Utilities, Telecom, and Consumer Staples).
Information Technology has come under some pressure in November, but remains in the leadership group, while early moves toward possible leadership have been seen from Health Care and Consumer Discretionary.
Thanks for reading.
Twitter: @WillieDelwiche
Any opinions expressed herein are solely those of the author, and do not in any way represent the views or opinions of any other person or entity.

: Showing Some Signs of Emerging Strength")
