This trend in consumer confidence and whether CEO confidence can recover will be key areas of interest as we move into and through 2020.
Valuations are bearish. The degree to which stocks appear expensive varies by indicator. One of the more constructive valuation indicators we watch is the Value Line Price/Earnings ratio. This weekly indicator blends six-months of trailing earnings data with six months of forward data. It currently suggests that it would not take much earnings improvement and/or price correction to move valuations toward a more neutral level.
From a long-term perspective, current valuation levels for US large-cap stocks suggest forward returns could be muted. Supporting the call for a renewed emphasis on diversification, valuations overseas are at more historically favorable levels.
Sentiment is neutral. There is plenty of evidence that the S&P 500’s recent run into record territory has been accompanied by increased investor optimism. Weekly surveys and options data reflect this shift. At a time when sentiment data is getting a lot of focus, short-term indicators have become noisier.
While seeing optimism, we do not have evidence that it is widespread, deep-seated and excessive. In fact, there remain some pockets of continued skepticism. Equity fund flows have not shown outright optimism and consumers have a decidedly less rosy view of stocks now than just a few months ago. The percentage of consumers expecting stocks to decline over the coming year is actually high enough to be a contrarian bullish signal for stocks. The percentage of consumers expecting stocks to decline over the coming year is actually high enough to be a contrarian bullish signal for stocks.
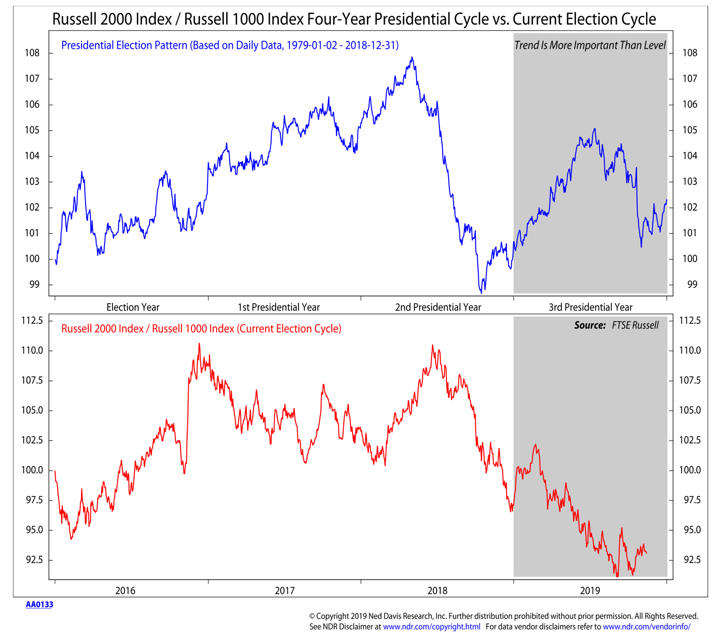
Seasonal patterns are neutral. Just as sentiment indicators are getting a lot of attention right now, so too are seasonal patterns. This has muted their efficacy in our view. To have confidence that the expected seasonal strength (which has been widely reported) is indeed emerging, we would like to have evidence beyond just headlines. Small-caps improving relative to large-caps would be helpful in this regard.
Election-year related patterns are likely being distorted by impeachment proceedings. Our view is that as long as Trump’s approval rating in the Gallup poll remains above 35%, these proceedings are likely more noise than news.
Breadth is bullish. An expanding percentage of industry groups are up-trends and global participation has been robust. The Europe ex UK index as more stocks trading above their 50-day averages than does the S&P 500. The percentage of global indexes moving to new 52-week highs is expanding, providing a more bullish backdrop than was present during previous rallies over the past two years.
While breadth has been sufficiently strong to merit an upgrade, it has not been without blemish. The new high list is disappointingly narrow and has struggled to consistently expand. The percentage of stocks trading above their 200-day averages has not moved to a new high.
It is not too early to begin adopting a more tactical focus – following strength and fading weakness. This will likely be the next iteration of the active/passive debate.
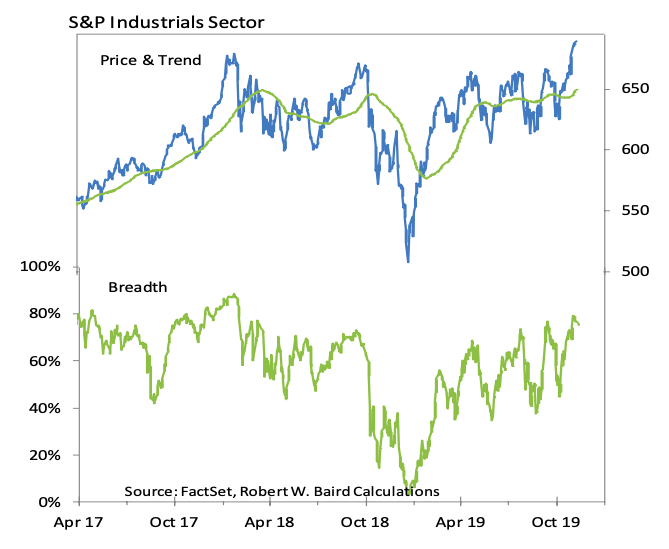
At the sector level, leadership from Utilities, Real Estate and Consumer Staples has faded. New leadership is being seen from Financials, Industrials and Materials. The Industrials sector has broken out to a new high while breadth has made a series of higher highs and higher lows.
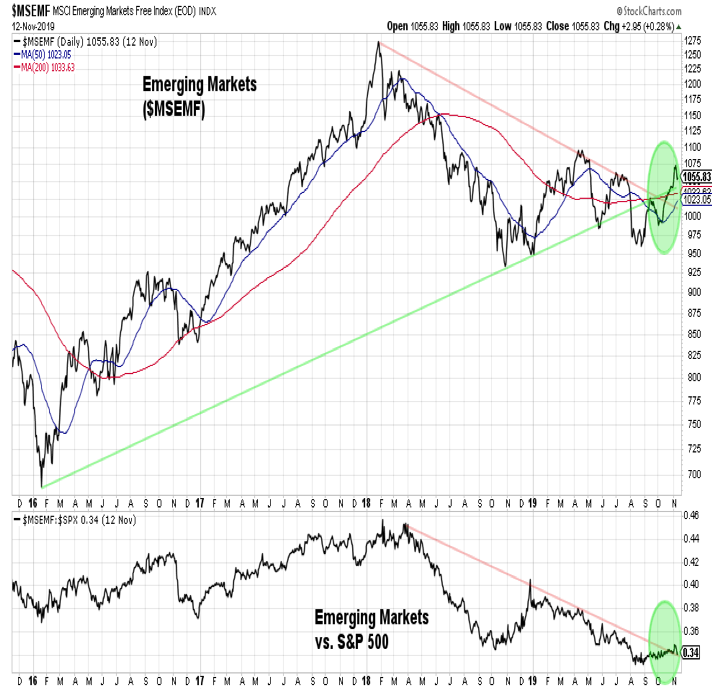
After a decade when global diversification depressed returns and increased risk for US investors, an opportunity for international leadership has re-emerged.
Emerging Markets are testing (and appear poised to break) a two-year down-trend on an absolute and relative basis. Recent improvement in copper prices supports strength in Emerging Market stocks.
The German DAX index is challenging its January 2018 peak and has been gaining strength versus the S&P 500.
The recent move higher in bond yields supports the view that investors will need to remain tactical and adaptive across asset classes.
Even though cash is under-owned from a historical perspective, its use as an active asset class should not be overlooked.
Twitter: @WillieDelwiche
Any opinions expressed herein are solely those of the author, and do not in any way represent the views or opinions of any other person or entity.


