If you spend time researching market relationships you can better understand money flows, rotation, and reasons why money flows rotate.
This can be very helpful in identifying trend changes as well.
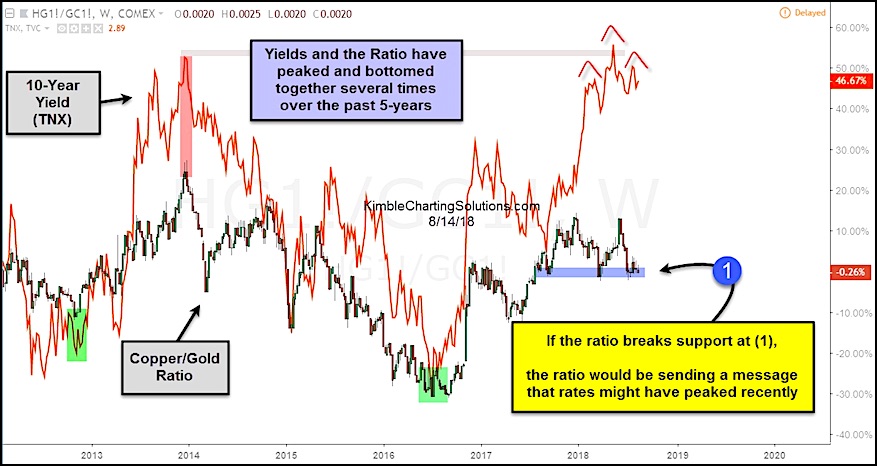
Today, we’ll look at the relationship between 10 Year US Treasury Bond Yield (INDEXCBOE: TNX) and the ratio of Copper (NYSEARCA: JJC) to Gold (NYSEARCA: GLD).
Interest Rates Peaking?
Looking at the chart below, we can see that treasury yields and the Copper/Gold ratio tend to peak and bottom together – this has occurred several times over the past 5 years.
Currently, the 10 Year Yield is forming a bearish head and shoulders pattern (in red) at the same time that the Copper/Gold ratio is testing important support (point 1).
If the ratio breaks the support at point 1, it would send a message that interest rates might have peaked for the near-term. Pay attention here!
Treasury Yields vs Copper/Gold Ratio Chart
Note that KimbleCharting is offering a 30 day Free trial to See It Market readers. Just send me an email to services@kimblechartingsolutions.com for details to get set up.
Twitter: @KimbleCharting
Any opinions expressed herein are solely those of the author, and do not in any way represent the views or opinions of any other person or entity.


