I have been following Intel Corporation (INTC) for some time. And once again, this big tech titan is near an important juncture. Especially for those that are looking to get long INTC stock.
In early June of 2015, I highlighted a BUY pattern on Intel stock chart. It came at around $25 (price support at the time) and the stock responded by rallying to $35.
Then, in my last update (Nov 2015), I offered up some downside price targets as long as $35 resistance held (a sell pattern). It did hold and INTC has fallen about 8 bucks.
Time for another update.
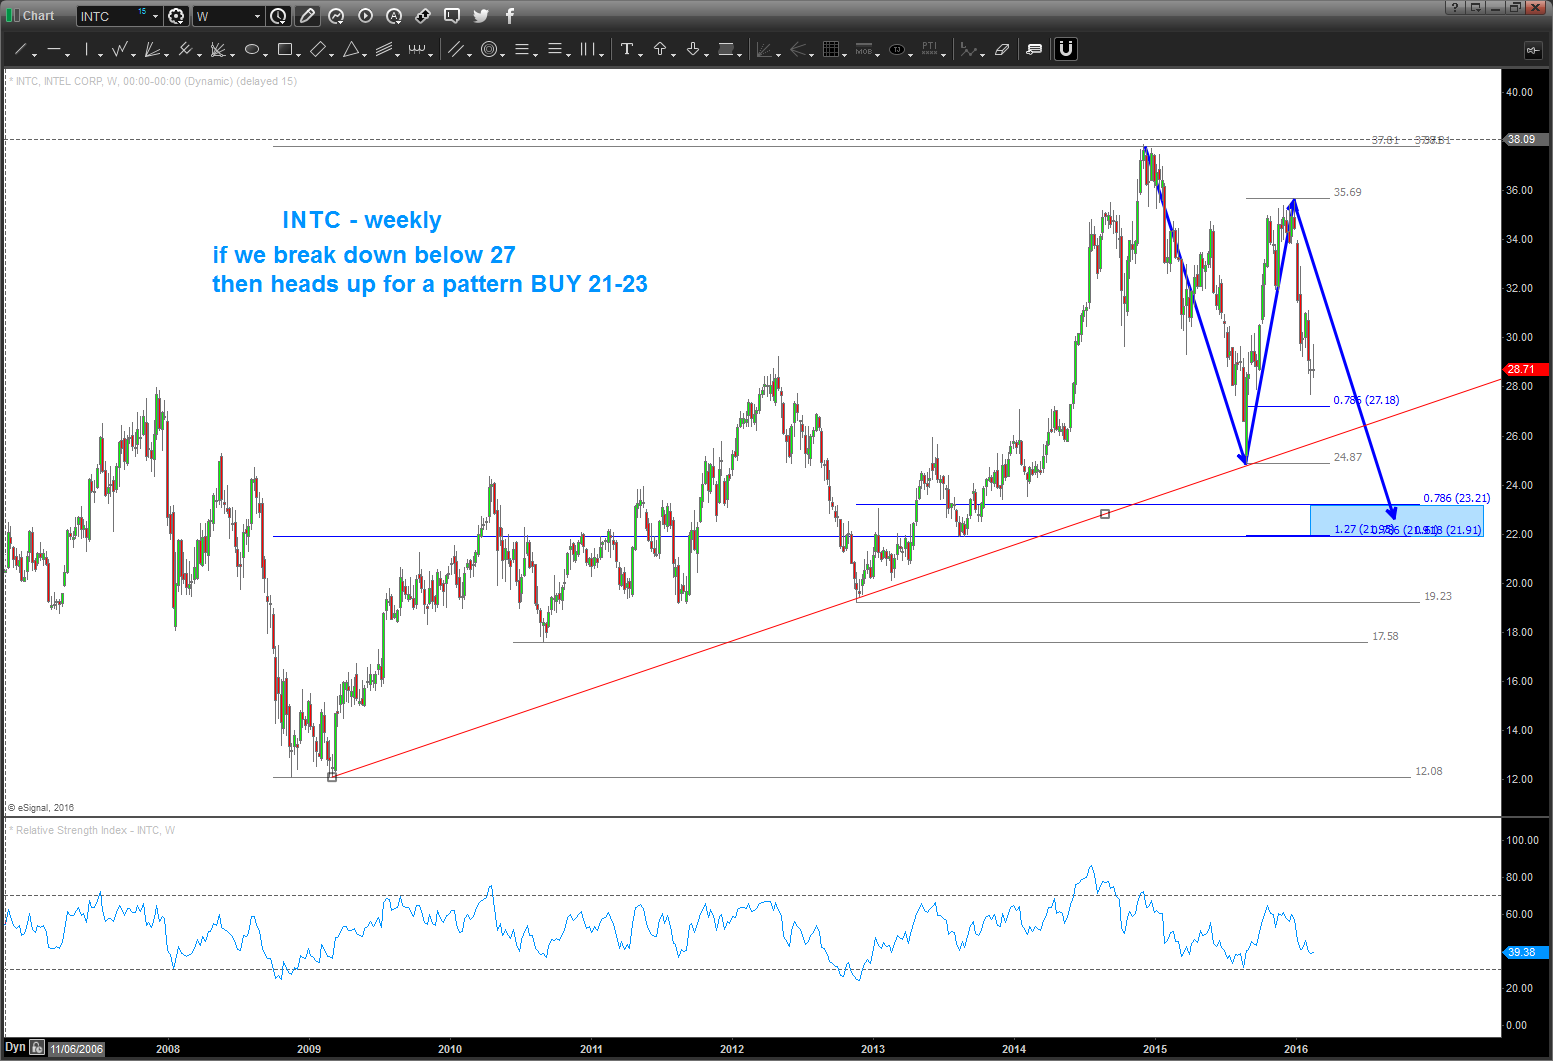
The decline is nearing a couple of logical buy zones. $27.18 is the first price support area based on the charts. I think longs can nibble in and around here. However, if INTC loses 27.18 on a daily close (below), followed by a close beneath the rising trend line, then the next logical BUY zone would be around $21-$23. Either way, I believe one of these areas will lead $INTC on a rally back to new highs. But discipline (stops) are needed when nibbling around current levels.
Intel Stock Chart (INTC) – Weekly
Thanks for reading.
Further reading by Bart: “Consumer Staples Relative Strength Nearing Extremes“
Twitter: @BartsCharts
Author does not have a position in mentioned securities at the time of publication. Any opinions expressed herein are solely those of the author, and do not in any way represent the views or opinions of any other person or entity.


