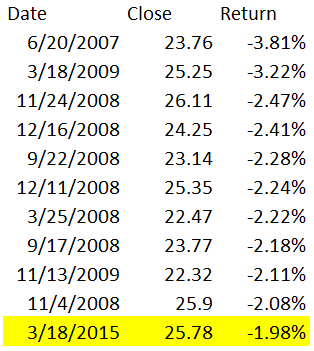
What a move we saw in the US Dollar Index (DXY) on Wednesday. It was the biggest decline in the US Dollar ETF (UUP) since November 13, 2009. Below you can see the worst daily performances in UUP since its inception in 2007.
What is interesting about using UUP versus the DXY is that it gives you a sense of the move in the US Dollar within the same trading hours as US stocks.
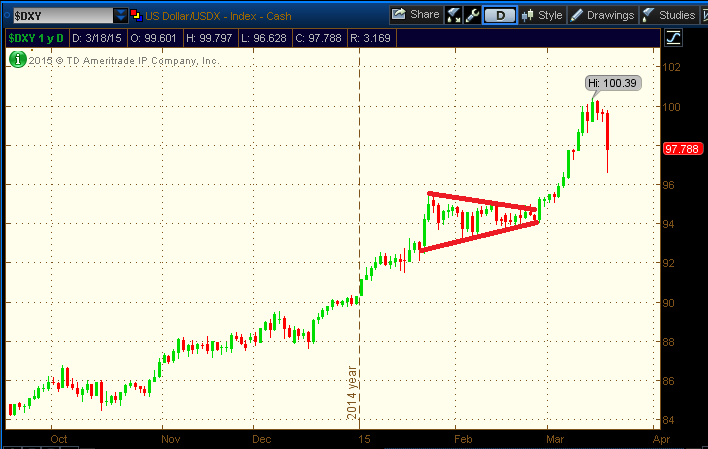
Turning to the chart of the US Dollar Index, you can see the rapid ascent into 2015. After briefly topping the 100 psychological mark late last week, it fell all the way back below the 98 level. Despite Wednesday’s massive decline, the index was back to the level at which it stood on March 10. If the Dollar continues to slide, lower support can be found at the breakout level from late February, between 94 and 95.
US Dollar Index Daily Chart
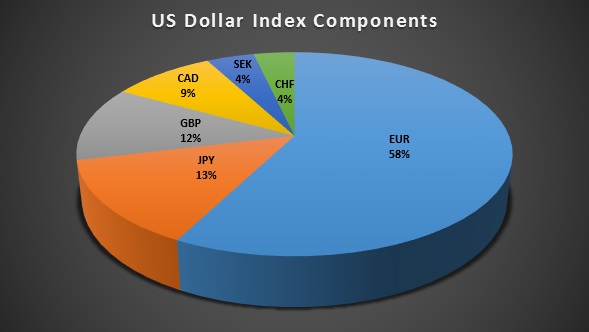
For a bit of background, the DXY measures the US Dollar against a basket of currencies, but it is not as diverse as you may expect. The majority (58%) of the DXY is the EURUSD.
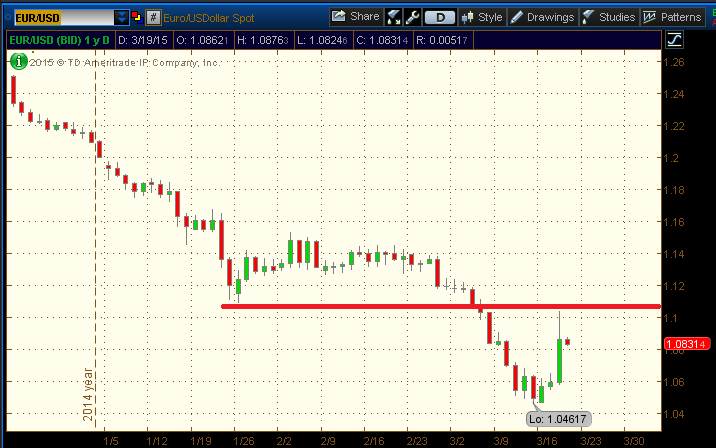
Given the high weighting of the Euro in the DXY, let’s take a look at the 3-month chart of EURUSD. The major spike that occurred in EURUSD just after the close of the equity markets yesterday brought the currency pair to near the January low. We have a clear resistance point for EURUSD between 1.10 and 1.11. A move above 1.11 would help confirm a near-term bottom.
EURUSD Daily Chart
Thanks for reading.
Follow Mike on Twitter: @MikeZaccardi
No position in any of the mentioned securities at the time of publication. Any opinions expressed herein are solely those of the author, and do not in any way represent the views or opinions of any other person or entity.

: Showing Some Signs of Emerging Strength")
