The technology sector has become one of the most dominant areas of the market over the last ten years and currently represents 20.48% of the market capitalization within the SPDR S&P 500 ETF (SPY). As a result, the biggest names are closely watched during earnings season and often play a pivotal role in overall market dynamics. Today, we’ll look at the composition and performance of a few broad technology ETFs.
There are currently 55 exchange-traded funds (ETFs) dedicated to varying subsets of technology stocks. That number can be greatly expanded when you take into account ancillary funds that demonstrate overweight exposure in this area as well. Let’s dive into how some of these top funds are constructed and what to watch for in the second quarter of 2016.
KNOW WHAT YOU OWN: Technology ETFs
Reviewing The Playing Field – David Fabian
Those that want to only play with big tech companies in their purest form will no doubt turn to the Technology Select Sector SPDR (XLK). This fund owns 75 large-cap companies such as Apple Inc (AAPL), Microsoft Corp (MSFT), and Facebook Inc (FB).
XLK is constructed using a market-cap weighted methodology that gives the lion’s share of the assets to the largest stocks. As a result, AAPL represents nearly 14% of the underlying asset allocation.
When it comes to size and liquidity, this fund has everyone else beat hands down. XLK has $13.87 billion in total assets and trades average daily volume of more than 11 million shares per day. Furthermore, this technology ETF only charges a modest 0.14% expense ratio as its ongoing management fee.
Those who are searching for a far-reaching take on technology stocks should look at the iShares Global Tech ETF (IXN). This ETF broadens its index criteria to 111 holdings and dedicates 23% of the portfolio to foreign stocks.
While the majority of the world’s largest tech companies are based here in the U.S., there can be some advantages to stepping outside a strict domestic focus as well. The small slice of international holdings in IXN has the potential to benefit from currency and consumer trends outside of traditional channels.
Lastly, it’s hard to talk about the dominance of the tech sector without mentioning the PowerShares QQQ (QQQ). This fund is based on the NASDAQ-100 index, which selects the largest non-financial stocks trading on the NASDAQ exchange.
Currently QQQ is 55.80% allocated to the technology sector, with consumer discretionary and health care rounding out the majority of the remaining asset allocation. While QQQ isn’t strictly a tech fund, many investors associate this index with its obvious overweight bias.
The unique composition of QQQ has allowed this growth-oriented fund to thrive with $37 billion in total assets and a modest expense ratio of 0.20%.
Technical Review – Aaron Jackson
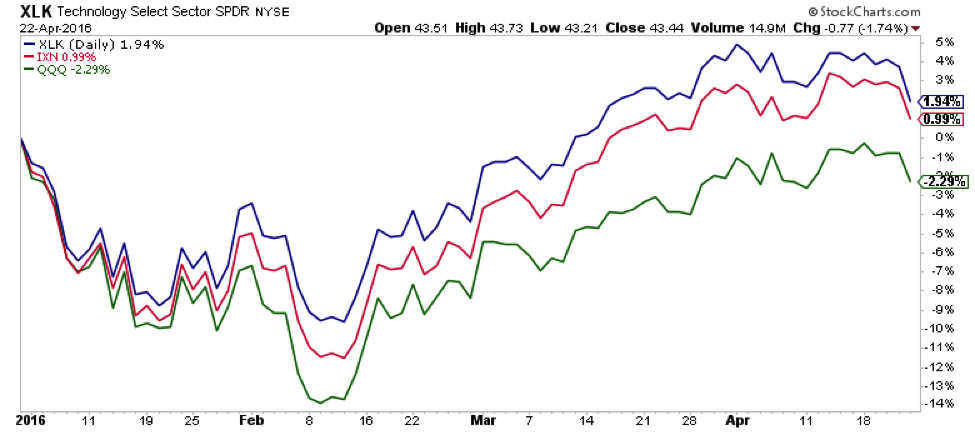
Comparing the year to date performance of the three technology ETFs, two things stand out.
- The narrowest fund XLK is leading. In a healthy market, we would expect to see the broader technology ETFs and funds leading.
- QQQ has lagged the more pure tech funds.
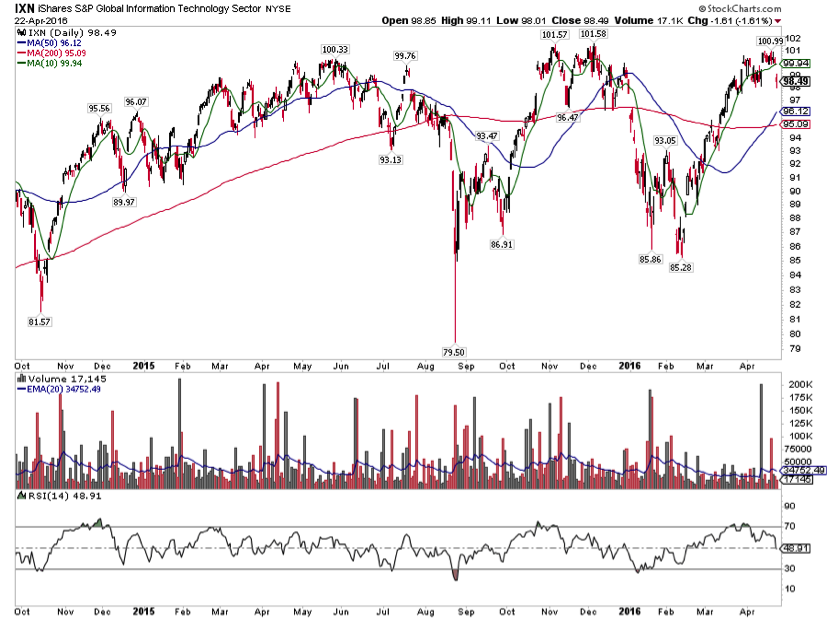
Looking at IXN, we see it’s traded in this range between 85 and 101 for over a year now. We can expect that to continue until it doesn’t.
Conclusions:
- Powershares QQQ is not a pure tech fund.
- Little known fund IXN is the best proxy of the three for global tech stocks.
- The narrowest fund is leading, and that’s something tech bulls want to see change.
Thanks for reading!
This article is part of a series co-authored by David Fabian (fmdcapital.com) and Aaron Jackson (northstarta.com). Each week we will be unlocking the secrets to some of the most talked-about exchange-traded funds in the market. The goal is to better understand what you own or elevate new ideas to the forefront of your watch list.
Twitter: @fabiancapital @ATMCharts
The authors may hold a position in the mentioned securities at the time of publication. Any opinions expressed herein are solely those of the authors, and do not in any way represent the views or opinions of each other or any other person or entity.


