As the stock market rallied 20 to 30 percent off its December lows, investors slowly warmed up to the idea of a renewed bull market.
But they shouldn’t get too cocky just yet.
The rally has seen its share of divergences, both technically and inter-market amongst the major indices.
For instance, the S&P 500 and Nasdaq rallied to new all-time highs, while the Russell 2000 and Dow Jones Industrial Average did not.
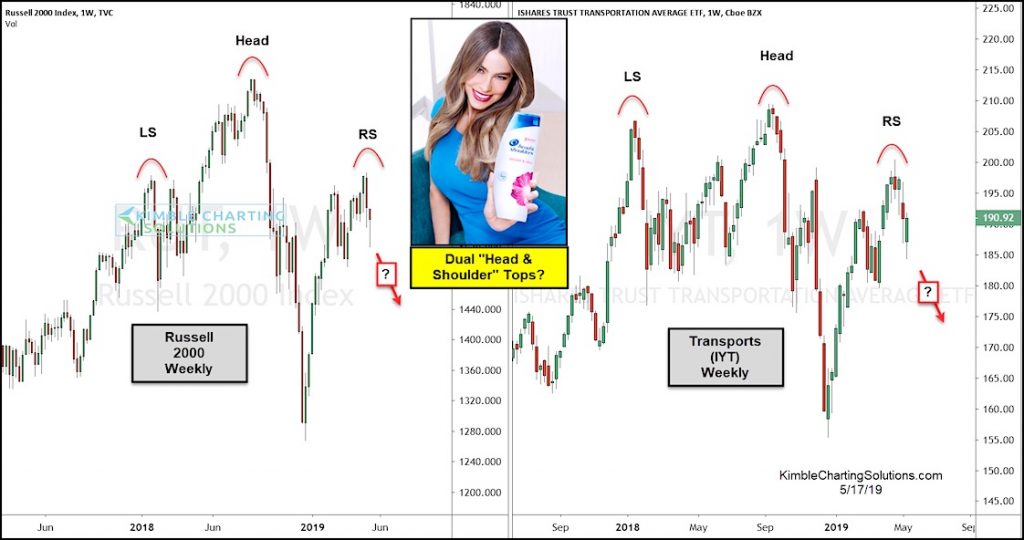
Today’s chart 2-pack looks at the Russell 2000 (NYSEARCA: IWM), along with another key stock market sector that failed to make new all-time highs: the Transportation Sector (NYSEARCA: IYT).
In fact, a closer look at the charts shows the potential for a bearish head and shoulders pattern on these two important indexes.
Stock market bulls do not want to see selling pick up here!
Russell 2000 (IWM) and Transportation (IYT) Charts
Note that KimbleCharting is offering a 2 week Free trial to See It Market readers. Just send me an email to services@kimblechartingsolutions.com for details to get set up.
Twitter: @KimbleCharting
Any opinions expressed herein are solely those of the author, and do not in any way represent the views or opinions of any other person or entity.


