Over the past year, I have written a couple of posts on International Business Machines (IBM). The first post came late last year when I discussed why IBM stock may be headed higher into 2015. That “swing” turning point worked well.
But after the rally began to take shape, I followed up with another post warning about the formidability of an $8 open gap serving as resistance. Although it would have been nice to see IBM mount that level, the resistance turned the stock back down.
Thus far, these pivots have worked but, invariably, IBM stock has gone lower and it’s time to erase the chart and look at it once again from top down.
Here’s an updated chart showing the power of that $8 gap. click charts to enlarge
IBM Daily Chart – mind the gap!
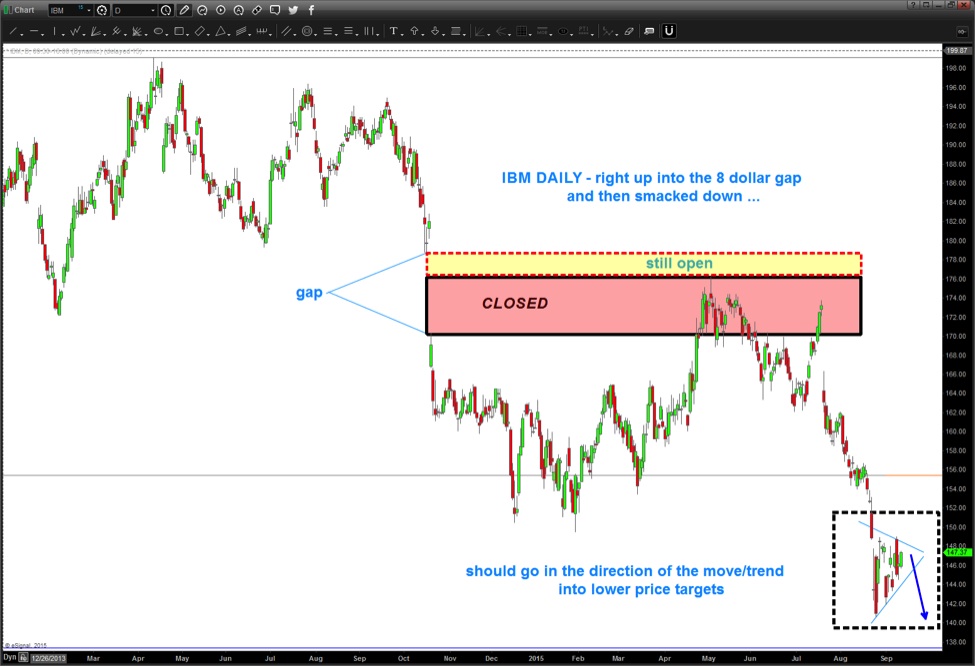
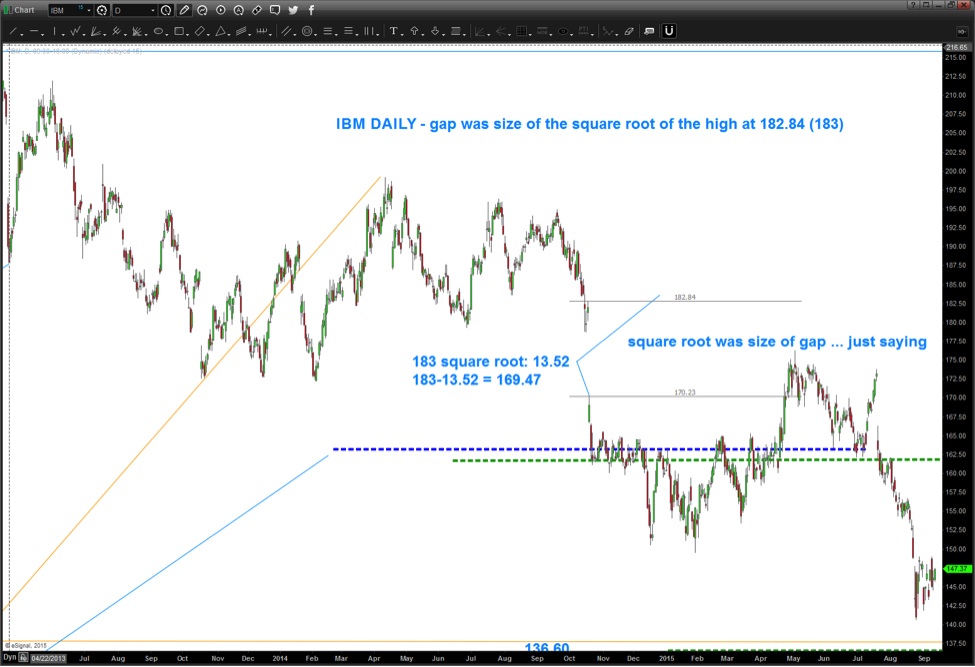
Here’s an interesting technique to work with in gaps or windows – use the square root of the high to project the size of the gap. When looking at stop placements – a square root component is always something to be aware of…
So where does that leave us now with IBM stock? The chart below has a lot of “technical” stuff coming into play and highlights some lower IBM price targets.
- Polarity – former 1999-2000 resistance should now become support
- An oversold and bullish divergence that stretches back 30+ years
- Overlapping Fibonacci clusters 135-137
- A “clear” 5 wave count lower
- A square root target
- Geometry (orange lines)
Probability is high for this support area (131-137) to be formidable support for a very strong bounce which should, initially, target 175 – the area of the previous 4th wave.
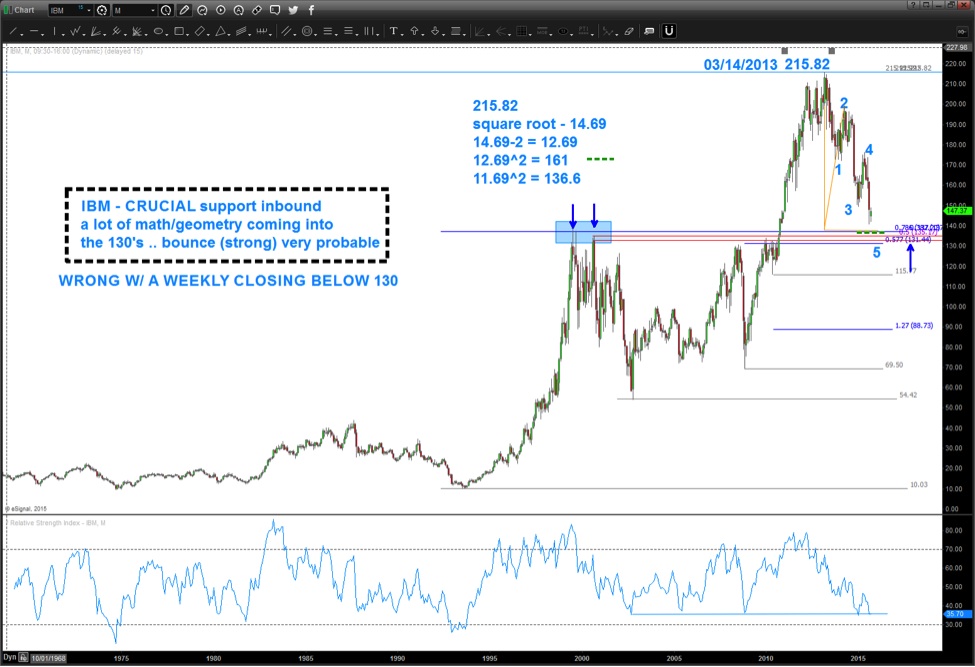
The caveat: On the flip side, any weekly closing below 130 would be very bad. Period.
Take a look at this monthly log chart below. IBM stock price broke and closed below (monthly basis) this log trend line from 1993. That’s an ominous sign so take that into account. I’m looking at this as having the potential to be a risk-defined swing trade with upside of 30-40 points (not a long-term investment!).
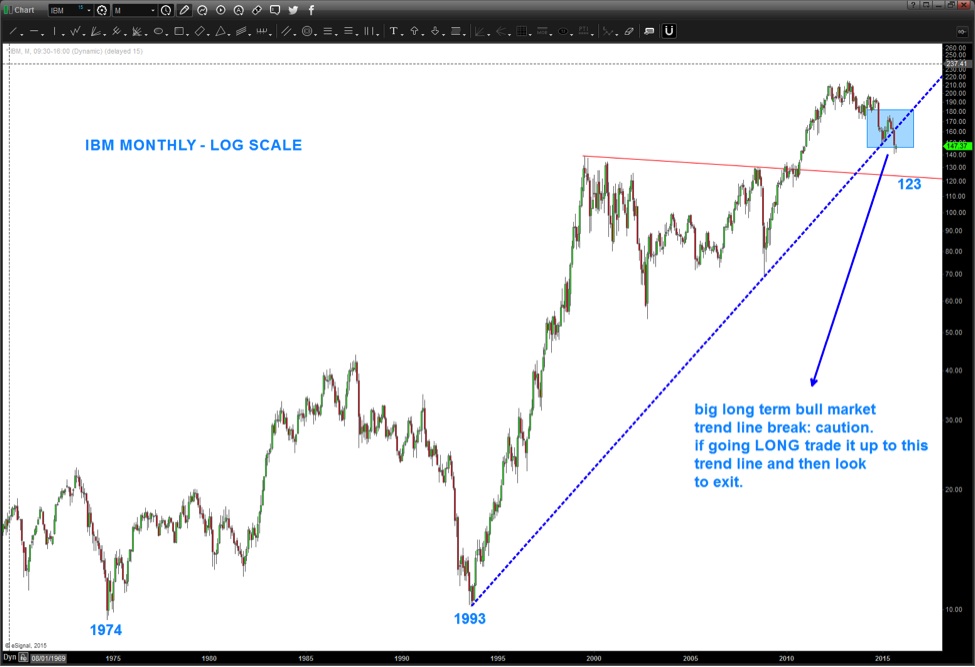
This is going to be a very crucial stock moving forward… the risks are defined, and the ramifications of the highlighted areas will tell us a lot with regard to where IBM is in the context of a bull/bear market run.
As always, let me know if you have any questions and thanks for reading.
Twitter: @BartsCharts
Author does not have a position in mentioned securities at the time of publication. Any opinions expressed herein are solely those of the author, and do not in any way represent the views or opinions of any other person or entity.


