The stock market has been in a bullish stance over the past several weeks and months. And even though that hasn’t definitively changed, it’s important to take notice when key indicators flash warning signs.
And today, we are seeing some flare up.
From market breadth to momentum to relative strength divergences, it’s apparent that investors need to keep risk on a tight leash.
In today’s chart, we look at the top growth/momentum stocks through the lens of the IBD 50 Index, a gauge of the top 50 growth stocks.
Note that the following MarketSmith charts are built with Investors Business Daily’s product suite.
I am an Investors Business Daily (IBD) partner and promote the use of their products. The entire platform offers a good mix of technical and fundamental data and education.
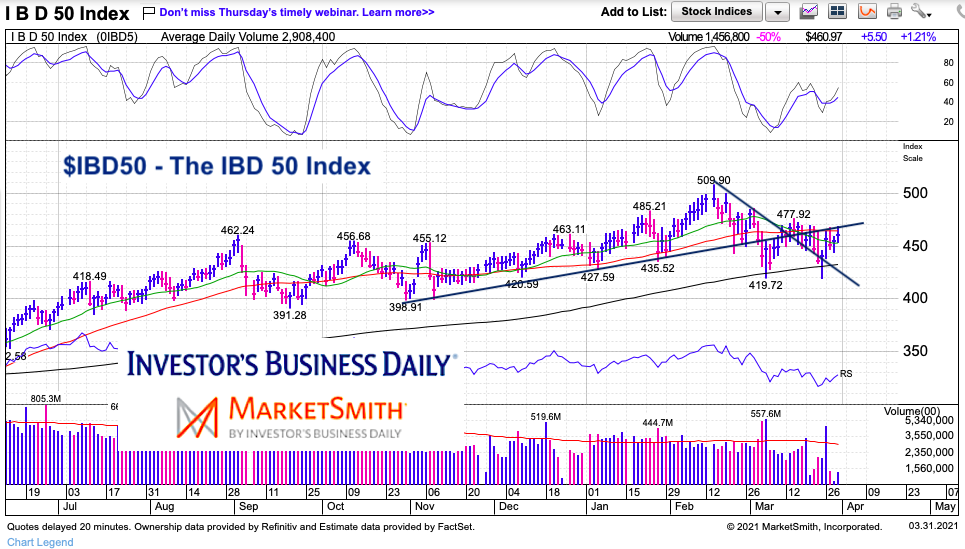
IBD 50 Index Chart
Here we can see conundrum. Many important tech stocks reached a momentum top last fall and price has been slogging along as the general market has continued higher. But the trend line from the fall pullback low was broken over the last month and stocks are in sort of a sideways churn.
A minor positive is that the IBD 50 Index broke its short-term downtrend line but that hasn’t lead to much of a rally. $420 is extremely important as that area marks a double bottom of sorts for the index. A breakout over $480 may lead to a retest of the highs. Trade em well.
Twitter: @andrewnyquist
The author may have a position in mentioned securities at the time of publication. Any opinions expressed herein are solely those of the author, and do not in any way represent the views or opinions of any other person or entity.


