STOCK MARKET VOLATILITY IS MORE COMMON THAN MOST BELIEVE
While they seem unprecedented and/or unnerving while they are occurring, stock market plunges and dislocations are not all that rare. Experience says those that remain cool, calm, and collected with their eye on data from multiple timeframes have the greatest chance of being satisfied with their results looking back six months from now.
“I learned at sea virtually all situations can be handled as long as the presence of mind is maintained.” – Josh Waitzkin, Chess Champion, The Art Of Learning
Therefore, we reviewed numerous cases of stock market plunges throughout history and decided to focus on eight of them as reference points to what’s happening today. See our research below.
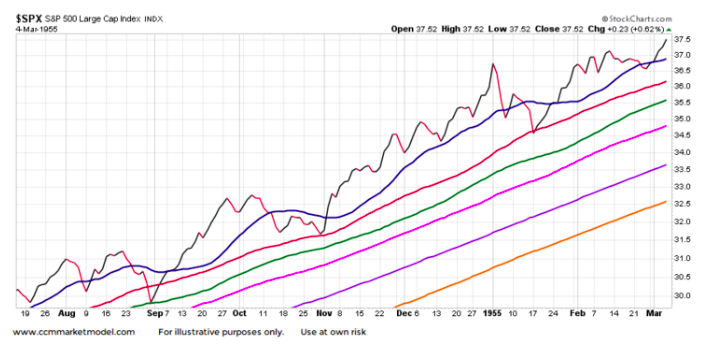
1955 PRE-PLUNGE
The set of charts below show the S&P 500’s pre-plunge stock market profile, allowing us to better understand the odds of a new bear market/prolonged correction.
The moving averages on each chart range from the 20-day (blue) to the 200-day (orange). The 1955 case looked good from a trend and conviction perspective. Price was above all the MAs, blue, the fastest moving average, remained on top looking back seven months, and the slopes of all the MAs were positive. All of that said “the market looks relatively healthy on multiple timeframes”.
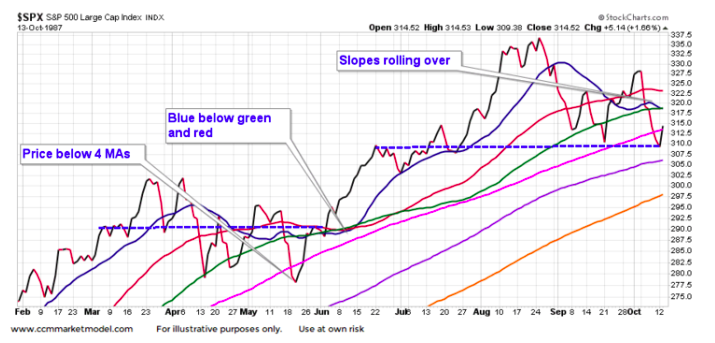
1987 PRE-PLUNGE
The 1987 stock market chart had quite a bit more evidence of a waning trend relative to 1955. The chart below is as of October 13 allowing us to see the market’s profile before the Black Monday plunge, which occurred on October 19, 1987.
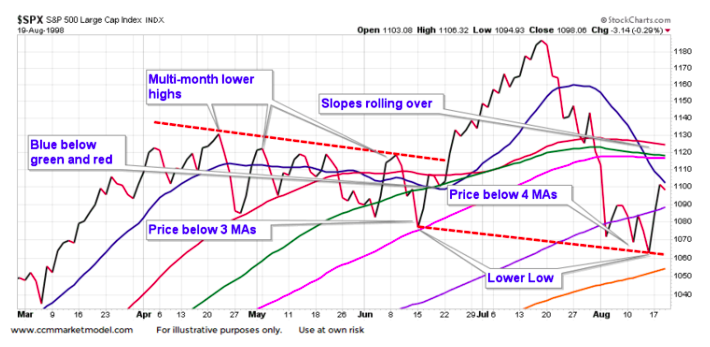
1998 PRE-PLUNGE
Like 1987, there were several signs of waning bullish trend in 1998.
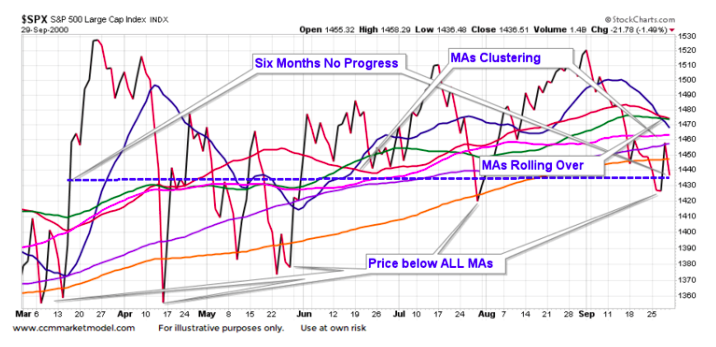
2000 PRE-PLUNGE
The stock market was a volatile, indecisive mess before tanking in September 2000. The 2000 profile was much worse than 1955.
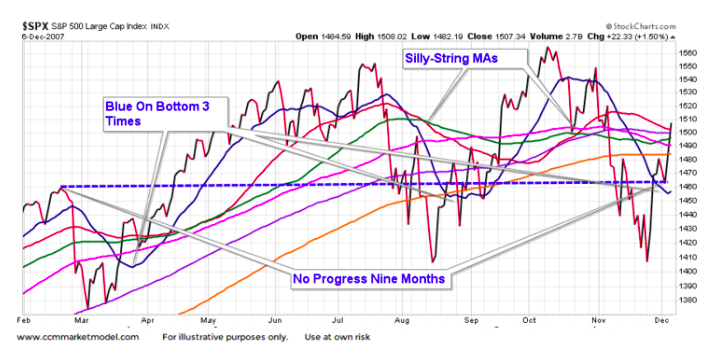
2007 PRE-PLUNGE
Sideways price action speaks to indecisiveness; stocks went sideways for nine months before tanking in December 2007. Compare the look of the 2007 chart below to the 1955 chart above – 1955 was making a series of higher highs and higher lows (bullish trend) – the chart below saw the stock market go absolutely nowhere for nine months (indecisive behavior).
Then came 2011…
continue reading on the next page…

 Rolling Over At Key Fibonacci Level?")

 Rolling Over At Key Fibonacci Level?")


