Home Depot stock (HD) has been like a rocket ship over the past few years. Since the 2011 bottom, the Home Depot stock has moved higher by 400 percent. Wow!
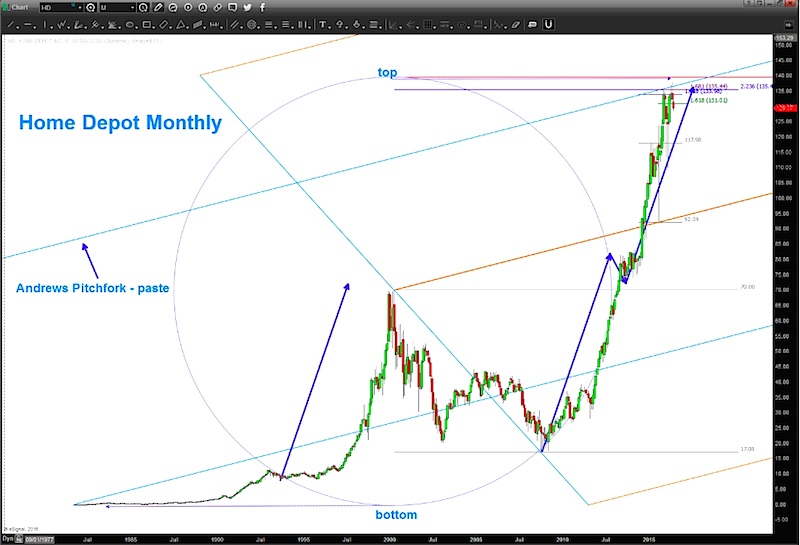
That said, the big box home improvement retailer has charted a path into a potential sell region… and this could mark a significant Home Depot stock top. Looking at the chart below, the top of the circle (and the math) appears to have worked as price targets for HD stock.
As a chart pattern recognition guy, I only focus on math, music, and symmetry of price movements. Read some of my prior work; I believe that it’s a powerful tool.
Here is a breakdown of what I’m seeing on the Home Depot “monthly” stock charts and why a Home Depot stock top may be in progress:
- I drew a circle w/ the radius equal to the biggest corrective move in it’s history
- By the way, the bottom of the circle is support in/around zero price so the top of the circle
- The blue arrows are the “measured moves” of HD throughout it’s history.
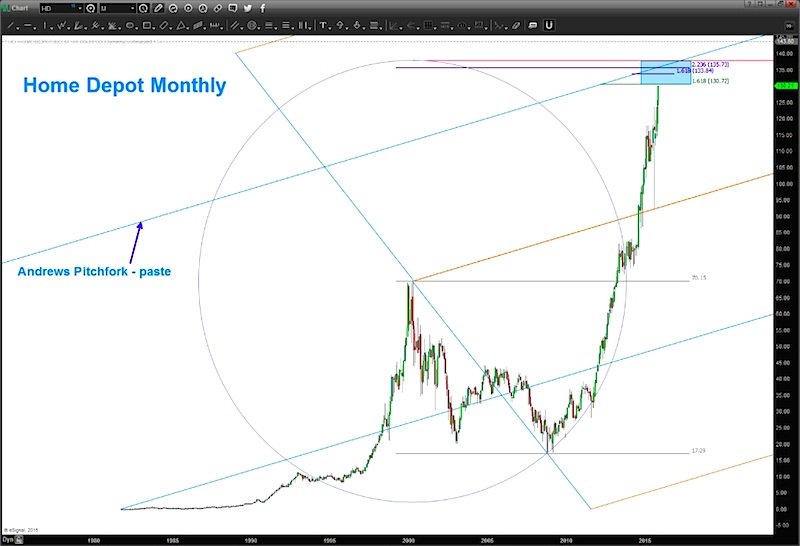
- We have a bunch of math coming in at the $130-$135 level.
- The “geometry” of the Adams Pitchfork from the IPO and all time low was simply copy/pasted and the median line stopped the rise in it’s track.
- I have ZERO idea about the fundamentals.
Learn to use crayons, it’s much easier than reading a 100 page document on HD and it’s fundamental stuff. I believe this could be a significant top for HD.
All bets are off on a strong move above $135. Thanks for reading.
Twitter: @BartsCharts
Author does not have a position in mentioned securities at the time of publication. Any opinions expressed herein are solely those of the author, and do not in any way represent the views or opinions of any other person or entity.

 Rolling Over At Key Fibonacci Level?")

 Rolling Over At Key Fibonacci Level?")


