The Hindenburg Omen is a broad market indicator that rarely signals, but when it does, you want to pay attention!
When a bull market is nearing its exhaustion point, certain characteristics can be identified that suggest an end to the bull run is near. The Hindenburg Omen, named after the infamous Hindenburg dirigible disaster, combines three different indicators as a composite measure of bull market exhaustion.
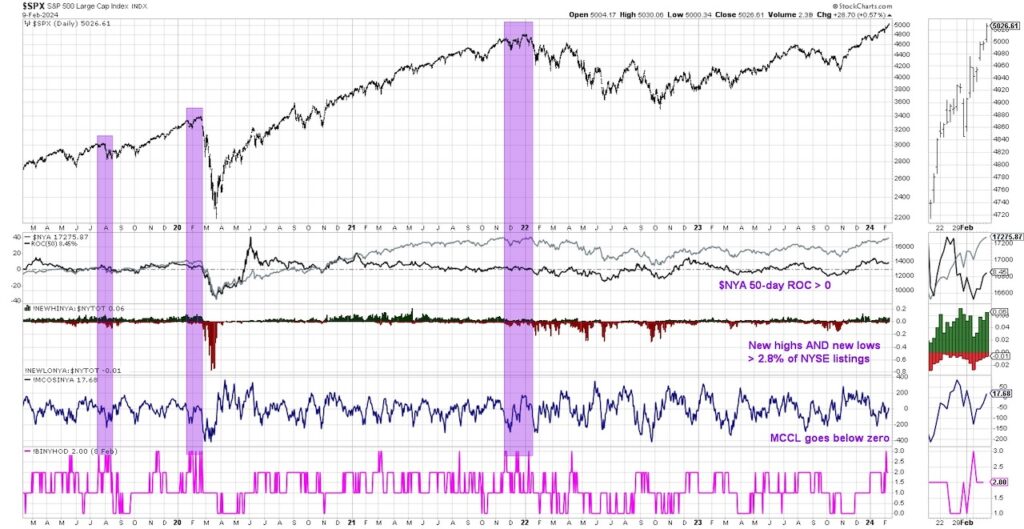
Bull market tops in 2000, 2007, 2018, 2020, and 2022 all saw the Hindenburg Omen flare up, but there have also been a number of false positives over time. Last week, we observed an initial signal from the Hindenburg Omen, meaning one more confirming signal in the next three to four weeks would complete the bearish trifecta.
In today’s video, we’ll explain the three components of the Hindenburg Omen, how this bearish indicator has been remarkably successful at identifying major market tops, and what it means for the S&P 500 and Nasdaq in Q1 2024.
- What are the characteristics of bull market tops, as described by the Hindenburg Omen?
- How can we use breadth indicators to anticipate shifts from bullish phase to bearish phase for the major equity benchmarks?
- How would a valid Hindenburg Omen signal in early 2024 relate to seasonal trends and other measures of market sentiment?
Stock Market Video: What To Make Of The Hindenburg Omen?
S&P 500 Index with Key Market Indicators
Twitter: @DKellerCMT
The author may have positions in mentioned securities at the time of publication. Any opinions expressed herein are solely those of the author, and do not in any way represent the views or opinions of any other person or entity.
: Creating Bullish Divergence?")


: Creating Bullish Divergence?")