There has been a relentless push into treasuries (NASDAQ:TLT) in recent months, but I believe that is coming to an end. I believe the panic into sub 2% paper is more related to lower and negative rates globally than worries over the economy. And this should resolve in higher treasury yields.
Think about this: If treasury bond participants pushed yields down this low only based on our expected economic growth in the states, we would already be in a recession.
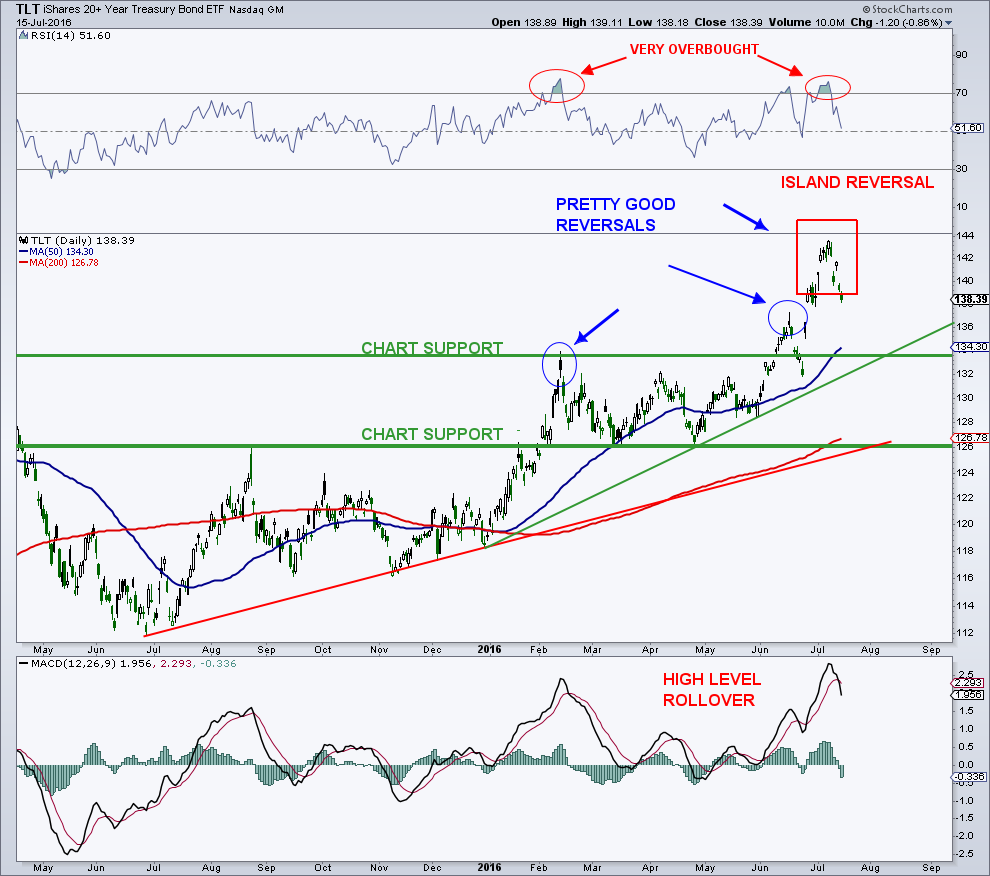
The iShares 20+ year Treasury bond ETF (NASDAQ:TLT) recently traced out a fairly bearish reversal called an island reversal. There is some minor overlap here so the pattern is not perfect. At the same time, daily momentum had cycled into fairly overbought territory which generally leads to at least a pullback. TLT is quite stretched from its 200-day moving average, also a concern, and something that always (eventually) leads to a retracement. Initial chart and trendline support sits down in the 134 area. I’m expecting a much greater pullback (correction) based on the weekly and monthly charts that follow. And lower treasury bond prices would mean higher treasury yields.
20 Year US Treasury Bond ETF (TLT) – Daily Chart
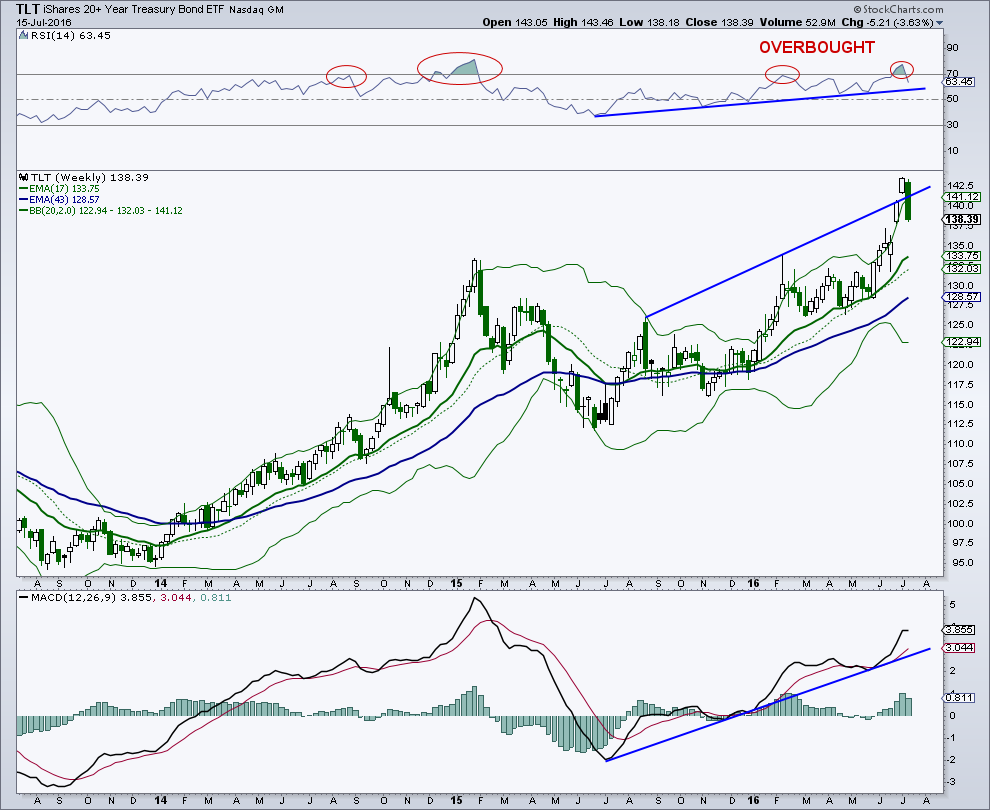
On the weekly chart, there was a double reversal this past week. The popular treasury bonds ETF (TLT) failed to hold its breakout above trendline resistance following a nasty week. In addition, TLT, which was trading above its upper Bollinger Band, pulled back within the bands. These are most often bearish for prices from an intermediate-term perspective. Weekly momentum had also cycled into overbought territory and that also can lead to trouble.
20 Year US Treasury Bond ETF (TLT) – Weekly Chart
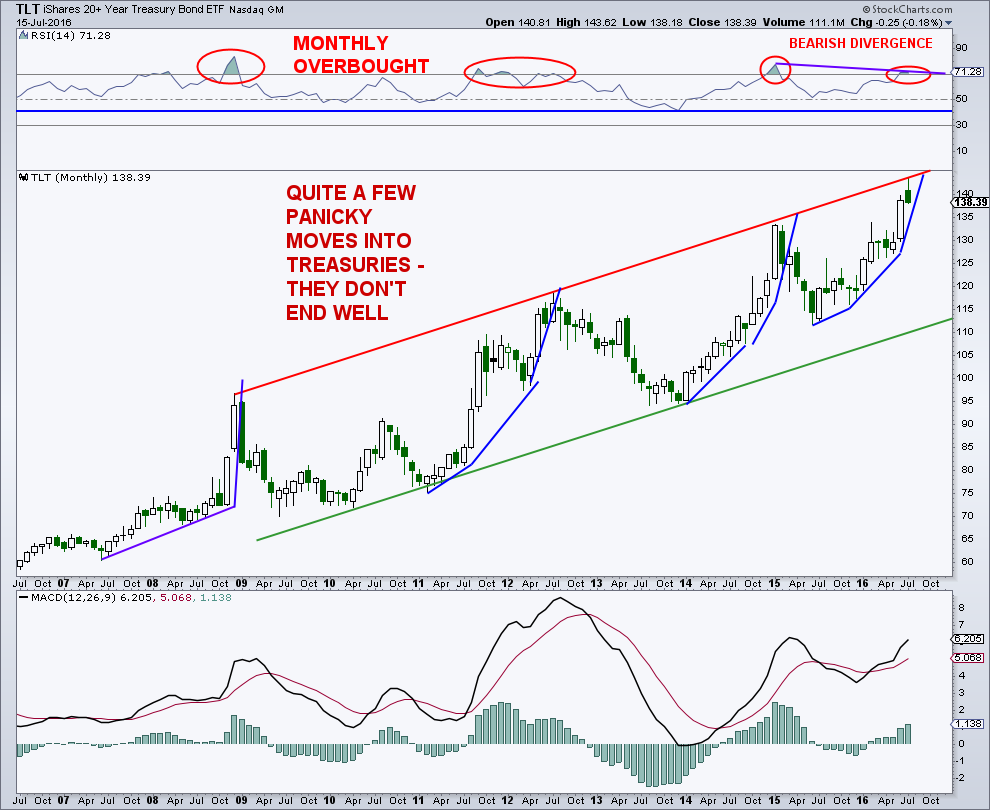
On the monthly chart, TLT has reached the top of a channel going back to 2008, and in very similar price fashion. Panic moves into treasuries has been quite common starting back with the financial crisis. These slopes are unsustainable and these parabolic moves tend to end badly. Monthly momentum has also cycled into overbought territory with the 14-month RSI showing a bearish divergence at the recent peak.
20 Year US Treasury Bond ETF (TLT) – Monthly Chart
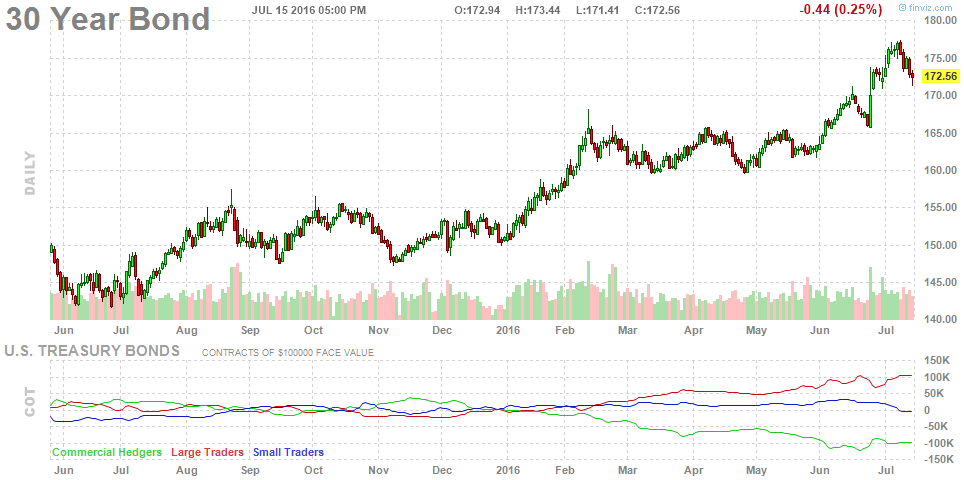
Checking in on the Commitment of Trader’s (COT) data for both the 10-year treasury note and the 30-year treasury bond, there is clearly a warning here as well. Commercial hedger’s (smart money) have large net short positions in the futures market while large speculators (not so smart money) have very large net long positions. Whether its bonds or any other market, this is not a good combination.
Commitment of Traders Report – 30 Year U.S. Treasury Bond
And finally, bond market sentiment toward the 10-year note and 30-year bond is extremely bullish. These sentiment readings come from www.sentimentrader.com.
There are lots of things here suggesting trouble for the treasury bond market so tread lightly. Higher treasury yields may be around the corner.
Note that I am currently short the treasury market through my position in TBT (an inverse ETF).
You can contact me at arbetermark@gmail.com for premium newsletter inquiries.
Twitter: @MarkArbeter
The author has a long position in TBT at the time of publication. Any opinions expressed herein are solely those of the author, and do not in any way represent the views or opinions of any other person or entity.
: Creating Bullish Divergence?")


: Creating Bullish Divergence?")