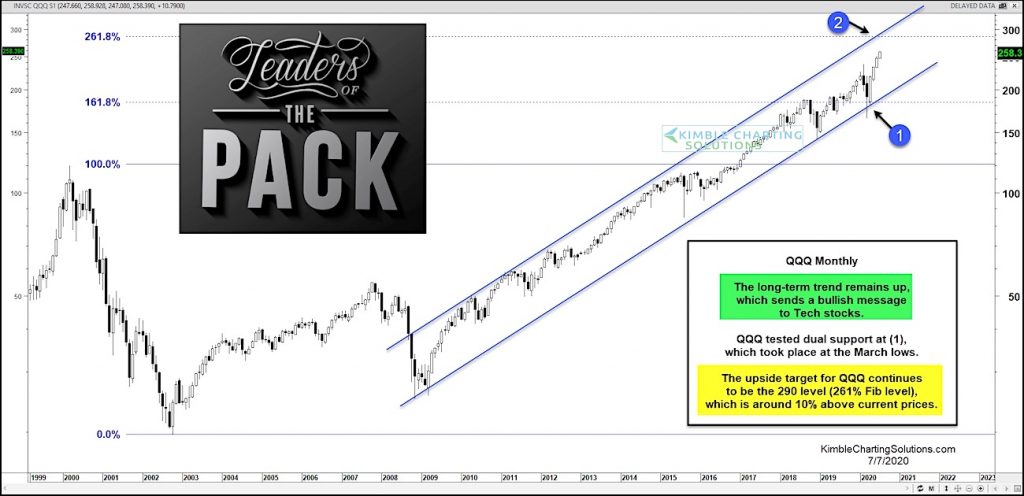
Nasdaq 100 ETF (QQQ) “monthly” Chart
The long-term trend for large cap tech stocks remains strongly in place.
And despite the steep rally out of the March lows, the index may be headed 10 percent higher.
Today’s chart highlights the $QQQ Nasdaq 100 ETF on a “monthly” basis. As you can see, the large cap tech index touched its lower up-trend channel support in March at (1) before reversing higher.
It may now be targeting the top of the trend channel at (2), which also marks the 261.8 Fibonacci extension (based on 2000 highs and 2002 lows). That Fib level is $290 on $QQQ.
If so, this upside target for $QQQ is still 10% above current prices. Stay tuned!
Note that KimbleCharting is offering a 2 week Free trial to See It Market readers. Just send me an email to services@kimblechartingsolutions.com for details to get set up.
Twitter: @KimbleCharting
Any opinions expressed herein are solely those of the author, and do not in any way represent the views or opinions of any other person or entity.

: Cup (and Maybe Handle) Watch")
 Trading Near Top Of Price Range")

