The average annual return of the S&P 500 over the past 100 years has only returned an approximated 7%. According to published resources, 85% of mutual funds portfolio managers do not beat the S&P 500. The average professional experienced trader (non hedge fund) typically earns less than 7% for their clients per year.
MEANWHILE…
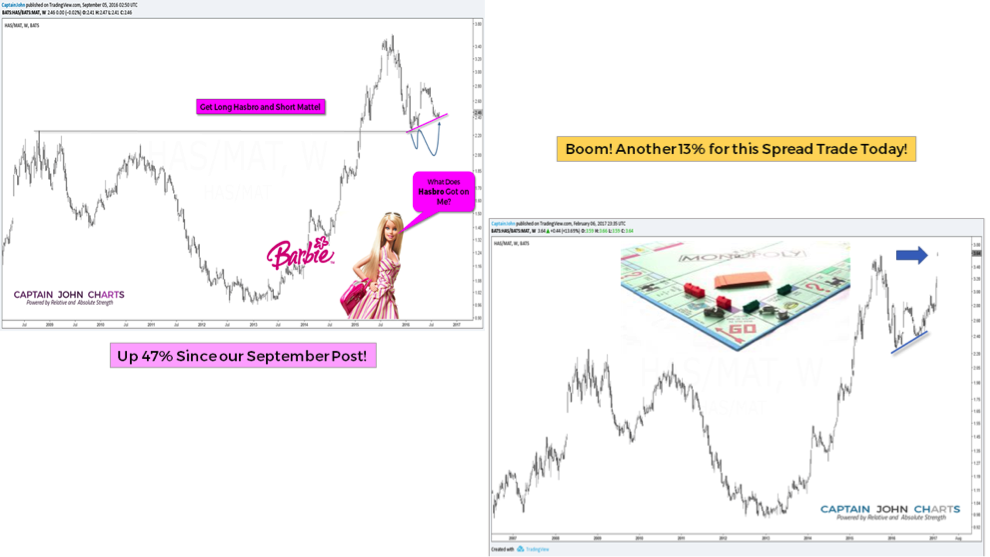
Our 2016 hedge trade between Hasbro (NASDAQ:HAS) and Mattel (NASDAQ:MAT) was up 15.73% on the short Mattel trade and 37.43% on the Long Hasbro trade.
We are able to utilize Hedging or Pairs Trade strategies to a great advantage due to our Discretionary authority, which allows us at our discretion to move a client in long and short or out of either quickly. The best Pairs trades capture the majority of the long and short profits simultaneously.
Hedging is defined as an investment made to reduce the risk of adverse price movements in an asset. Our technical, fundamental and pattern analysis revealed we could capture a great deal of the spread and profit by shorting the underperforming Mattel and entering a long on Hasbro. Little did we know how well this hedge would reward us for our patience and diligence.
“The success of the approach depends, for the most part on the skill of the individual chartist. The term “art charting” has been applied to this approach because chart reading is largely an art.” -John Murphy-
CHART HISTORY
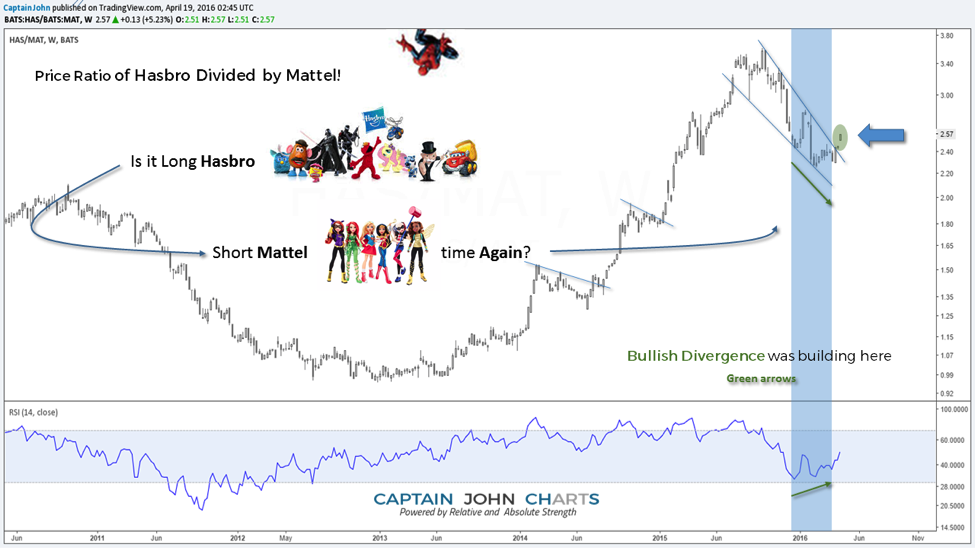
The comparison chart of $HAS vs $MAT seen below, from April 19, 2016, revealed 2016 there was a bullish divergence building. While price had been falling in Hasbro prior to 2016, the RSI revealed a hidden bullish divergence. Price also just had broke out of the downtrend.
HASBRO CHART APRIL 2016
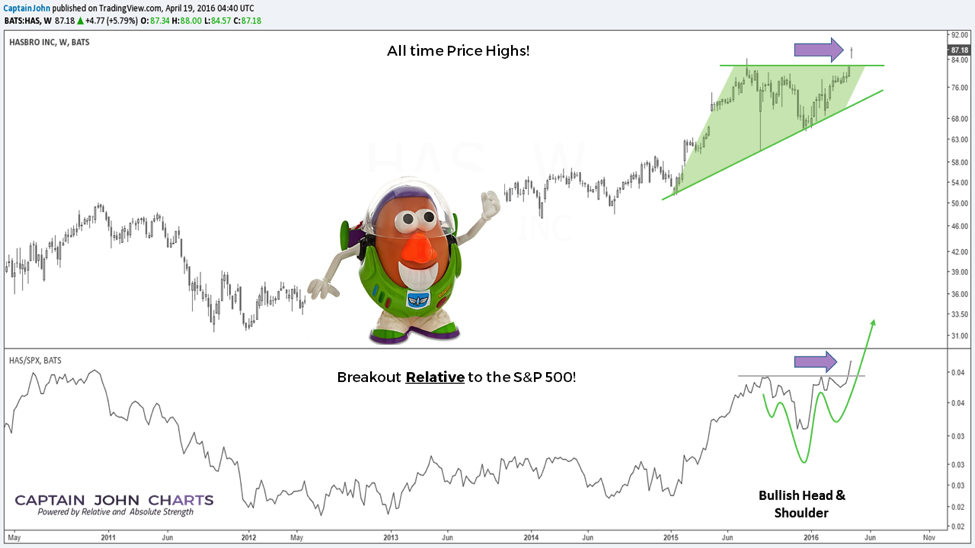
The Hasbro chart at the top shows all time price highs and a powerful breakout with a gap up while in the lower portion of the chart, we see Hasbro compared to $SPX. The bullish head and shoulder pattern on the RSI was another sign confirming not just the breakout relative to the S&P 500, but that the stock itself was a very bullish buy at $87.18
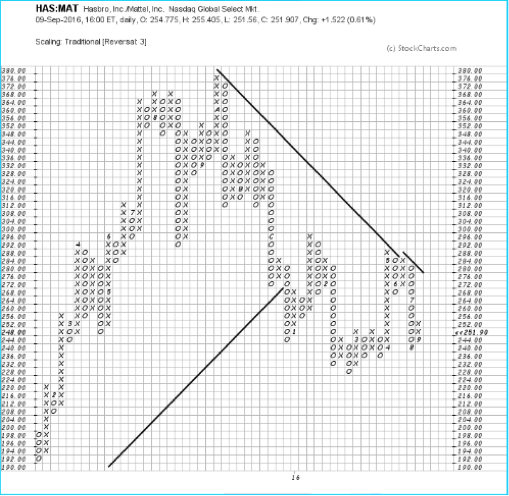
Another bullish point was the comparison Point and Figure chart of $HAS vs $MAT. (pictured below) The Point and Figure shows the final column in September of 2016 turned into a column of X’s. If you looked at Hasbro and Mattel individually on a Point and Figure chart, Hasbro was still on a sell signal. Mattel also had a triple top that had not been broken for a long time and continued to give bearish signals making the short side of the Pair trade look even more promising at that time.
In addition, the My Little Pony line had become a multi-million dollar empire that Hasbro strategically planned to take full advantage of by wrapping us back into it’s nostalgia and popularity with our own children and made plans to release a movie in 2017.
MATTEL ($MAT) SEPTEMBER 2016
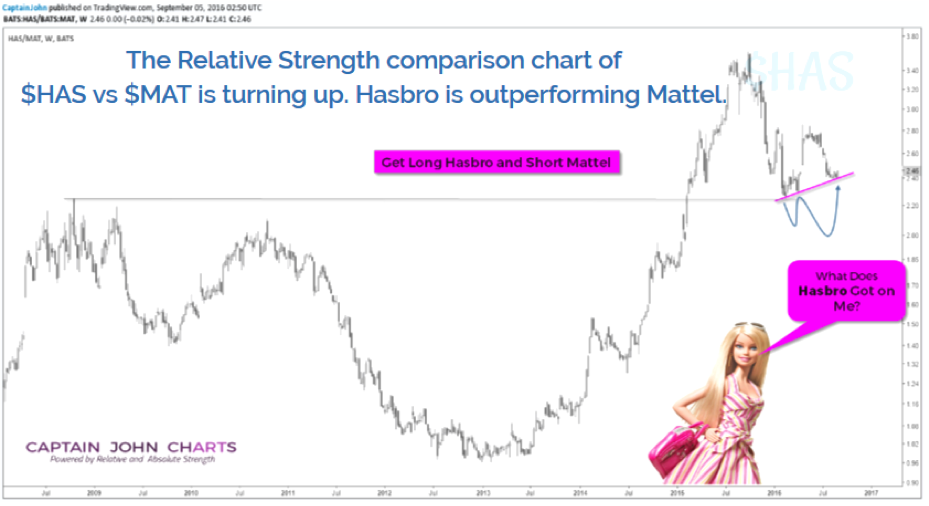
We reiterated in September that the Relative Strength comparison chart of $HAS vs. $MAT was still bullish and clearly turning up. (at pink line) There was still opportunity as Hasbro was still outperforming Mattel. By February 6, 2017 the September 2016 post about being long Hasbro was already at 47% profit and the short in Mattel was at a 13% gain.
CURRENT CHART ANALYSIS
Here we are already into July of 2017. The spread trade is now up to the long side in Hasbro, XX% and the short has earned XX%! You see the evolution of a pairs trade and must be wondering if the long or short or both are long in the tooth however more surprises were found inside the Hasbro comparison chart to Mattel.
July 10, 2017 $HAS vs. $MAT
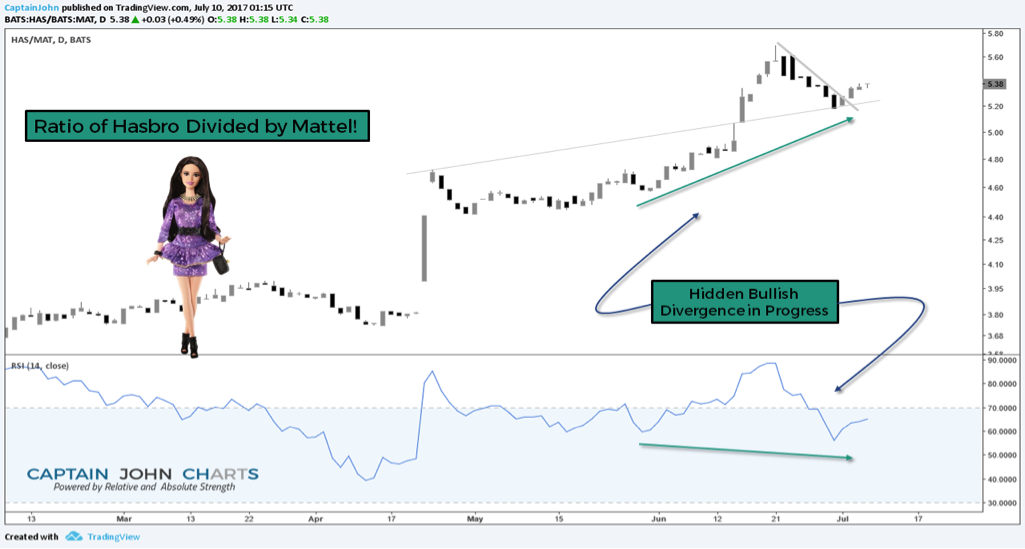
When analyzing a stock chart, it’s important to examine and scrutinize for divergences between price and RSI/Momentum. Finding a divergence is akin to spotting a small golden nugget in a river but finding a “hidden” divergence, is more like unveiling a pocket in the side of Mt. Antero filled with aquamarine, The hidden divergence shows what lies beneath the surface. Take a look above at our recent comparative chart of $HAS vs $MAT.
Hasbro appeared to be starting to underperform $MAT late winter, yet it was making higher lows in price and riding the green trend line; meanwhile RSI appeared to show momentum of selling accelerating with a lower low, which is the hallmark behavior of a hidden bullish divergence. Notice that price was making a higher high, but RSI was making a lower low. This indicates that the Hasbro toy domination and strength over Mattel is not ready to quit.
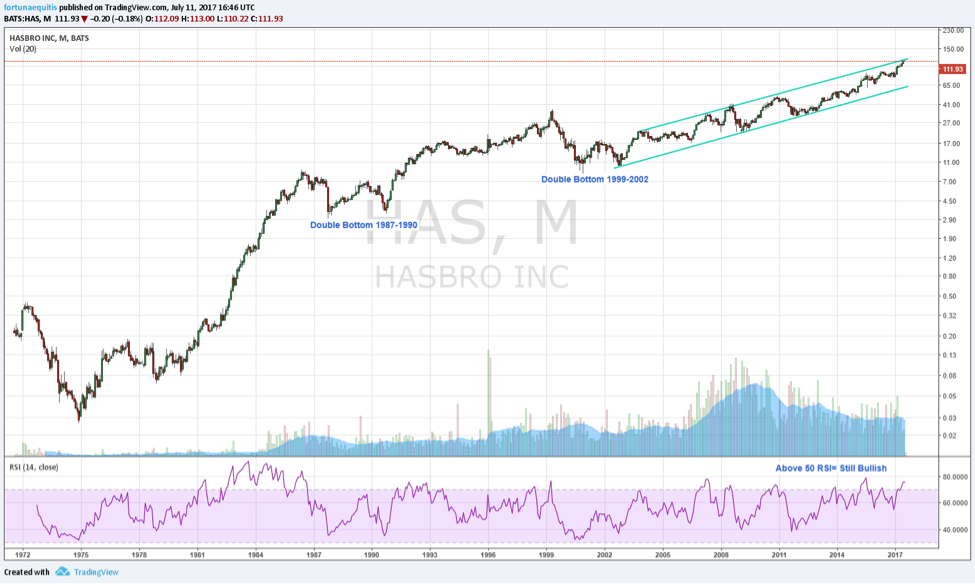
Hasbro’s long term monthly chart (below) shows price riding the top of the bullish trend channel and typically when price hits the top, it takes a mini pullback. As long as it bounces of the bottom of this channel, the long term outlook is still good for staying long and the RSI is healthy remaining above 50 which is also bullish.
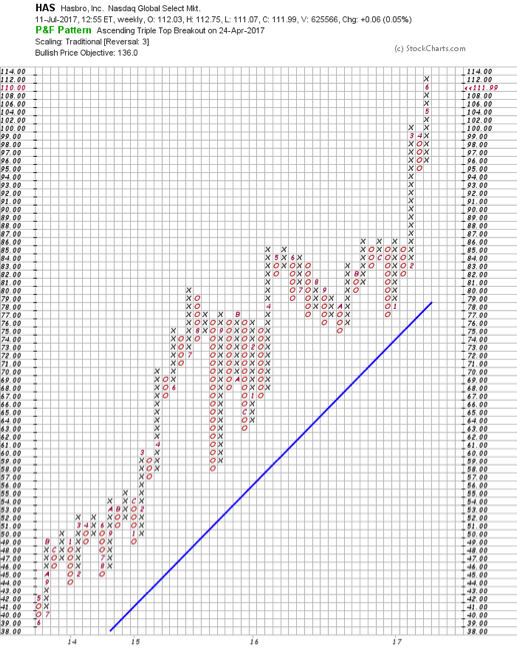
The Point and Figure chart of Hasbro is riding well above the blue bullish support line and repeatedly bounces off of it during pullbacks. This is what you like to see along with Ascending Triple Top breakouts (at 4) and bullish price objectives still offering really decent reward. How does a price objective of 136 sound?
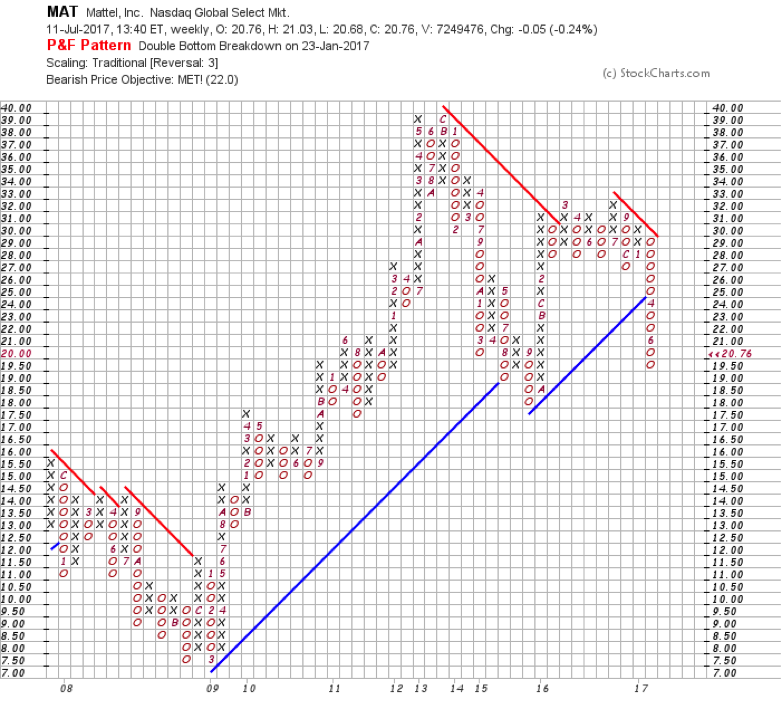
Mattel’s Point and Figure chart shows the short side of the story and makes a great study in contrast to a bullish chart for the student of Technical Analysis. Here we see the bullish support line and the bearish resistance line, with price hitting it and getting sold off hard, to the point that on January 23, 2017 the stock had a Double Bottom Breakdown to the pleasure of short seller with put options, and then dropped right through the bullish support line. This is a fine example of a chart as a long stockholder, you do not want to see. If you chose to hold it anyway, you most certainly needed to hedge.
It can pay very well for our client who is looking for a market neutral strategy to get into Pairs trades such as this; and when the long is strong and you ride the trend, it’s your best friend. Right now, John and I are looking at almost 119% profit which is like owning Boardwalk, Park place and having the key to Equestria on which we’ve built big red hotels.
Thanks for reading. Here’s to your success.
Our models and strategies are used by hundreds of financial professionals and some are tailored for the trader and retail investor with premium services. We create an independent investor who has the confidence to do what we have done for decades. If you need one of our several models to assist your client’s portfolio’s, that includes strategies such as this or others, contact us at john@captialmarketsiq.com.
Twitter: @CptJohnCharts
StockTwits: @CaptainJohn
The author has a position in the mentioned securities. Any opinions expressed herein are solely those of the author, and do not in any way represent the views or opinions of any other person or entity.
")


")
