The solid economic recovery and easing of COVID restrictions lead me to believe a tapering of QE may not be far off. Further supporting my opinion, inflation has fully recovered to pre-pandemic levels, and employment is improving rapidly.
On top of that are whispers from within the Federal Reserve (also referred to as “Fed”) questioning financial stability given extreme asset valuations driven to some degree by excessive QE.
Most importantly, various Federal Reserve members are starting to talk the taper talk.
The eventual tapering of QE will foster a change in investor behaviors. This article focuses on bond yields and a few interest-rate-sensitive equity sectors to provide forward guidance on how fixed income and interest-rate-sensitive assets may perform in a tapering environment.
Talking Taper
Jerome Powell repeatedly affirms the Fed “isn’t even thinking about thinking about tapering.” Of course, as Chairman of the Fed, his opinions take precedence over those from other Fed members. Regardless, other Fed members are not entirely on the same page as Powell.
The following comments and headlines came out over the last month.
- BULLARD: U.S. MAY BE “GETTING CLOSE” TO THE POINT WHERE PANDEMIC IS OVER, THEN ATTENTION COULD TURN TO POST-PANDEMIC MONETARY POLICY
- Lael Brainard: “Vulnerabilities associated with elevated risk appetite are rising.” The combination of stretched valuations with very high levels of corporate indebtedness bear watching because of the potential to amplify the effects of a repricing event.”
- Robert Kaplan: “The Fed should start talking about tapering bond-buying soon.” & “I am beginning to feel differently regarding the advantages and drawbacks of the Fed’s QE purchases.”
- Eric Rosengren: “the mortgage market probably doesn’t need as much support now.“
- “It may be that interest rates will have to rise somewhat to make sure our economy doesn’t overheat,” Yellen said in an interview with the Atlantic recorded Monday that was broadcast on the web on Tuesday. “It could cause some very modest increases in interest rates.” – Treasury Secretary Janet Yellen, per Bloomberg.
Other Taper Worthy Factors
Beyond hints from Federal Reserve members and robust economic data, banks and the money markets are encountering QE-related problems.
First, banks are struggling to digest the reserves they receive when the Fed purchases assets from them. As a result, their ongoing ability to facilitate additional amounts of QE is increasingly becoming problematic.
Zoltan Pozsar, credit analyst and Fed expert at Credit Suisse, summed the situation as follows:
“(The) use of the (reverse repurchase program RRP) facility has never been this high outside of quarter-end turns, and the fact that the use of the facility is this high on a sunny day mid-quarter means that banks don’t have the balance sheet to warehouse any more reserves at current spread levels.“
The second problem facing the Fed is the recent reduction of Treasury balances held at the Fed. As a result, the Treasury is issuing fewer short-term bonds, resulting in a scarcity of money market securities and collateral supporting derivatives. Consequently, short-term interest rates are starting to go negative.
The two problems make it progressively more challenging to maintain the pace of QE and keep rates from going negative.
QE, Taper, and Bond Yields
With an understanding of our case for tapering, let’s revisit how yields behaved during prior episodes of QE and the periods following QE.
The graph below shows the yield on ten-year UST notes rose during each QE period and fell upon its conclusion. As circled, yields fell precipitously when the Fed reversed QE via Quantitative Tightening (QT).
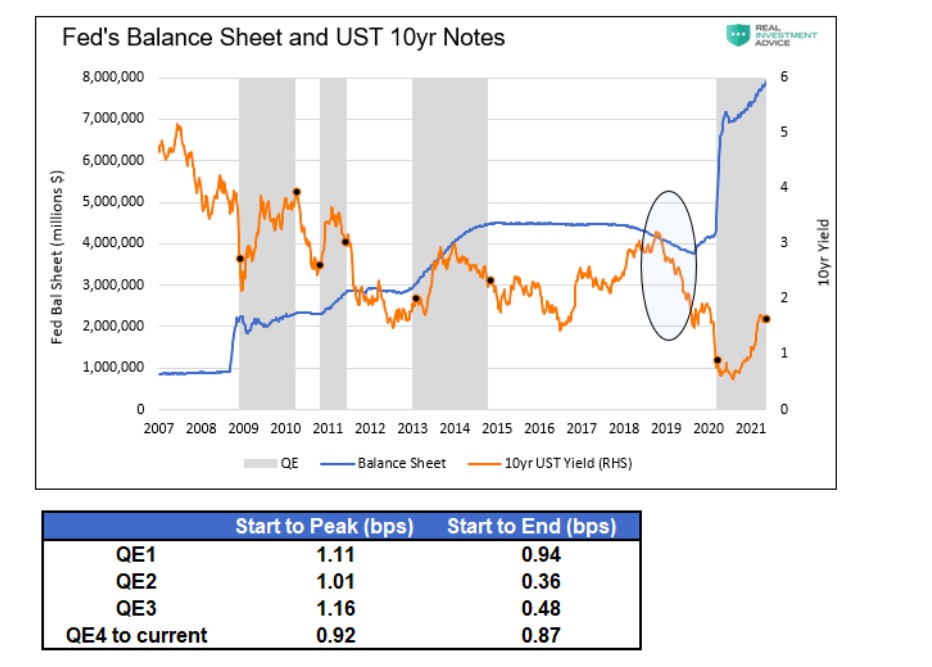
Ten-year yields tend to rise about 1% from the start of QE to peak yield levels during QE. Equally important, yields tend to fall toward the end of QE. The reason for peaking before QE ends is growing investor beliefs, at those times, the Fed was getting closer to tapering or halting QE purchases. The jury is still out on QE4.
Currently, yields are close to their cycle highs. If we believe the Fed is nearing tapering, yields could be peaking. Based on prior QE taper experiences, a yield decline of 1% or even more may be in store for the next six months to a year if the Fed is, in fact, on the doorsteps of tapering.
Similarly, the following graph compares the 2yr/10yr yield curve and the Fed’s balance sheet over the same QE periods.
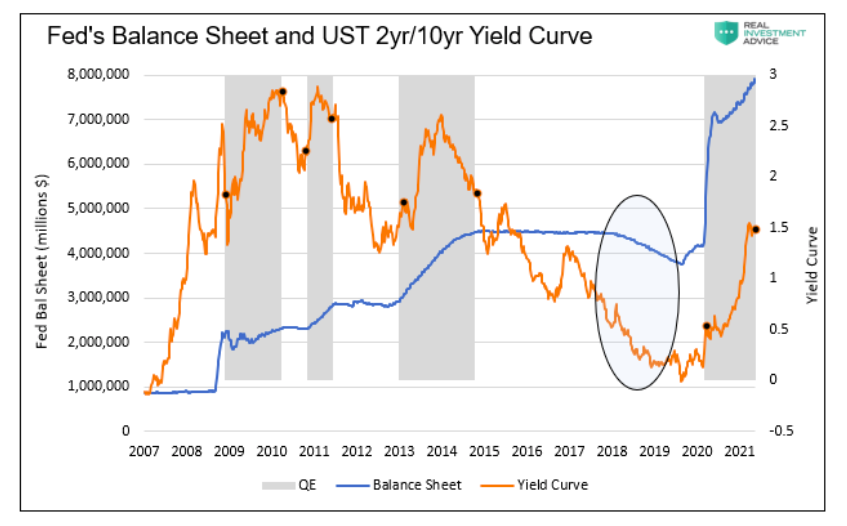
The yield curve and yield graphs look similar. Short-term yields were relatively constant during QE while long-term yields rose. In all three QE examples, the yield curve quickly flattened after QE ended.
Beyond Bonds
As our confidence in the Fed reducing its pace of QE heightens, our bond allocation and duration of bonds should increase. That said, we must also consider how other interest-rate-sensitive assets might do. Below we provide a similar analysis for financial stocks (XLF), preferred stocks (PFF), and MBS agency REITs (NLY).
The table below shows the returns of the three assets during QE and the six months following QE.
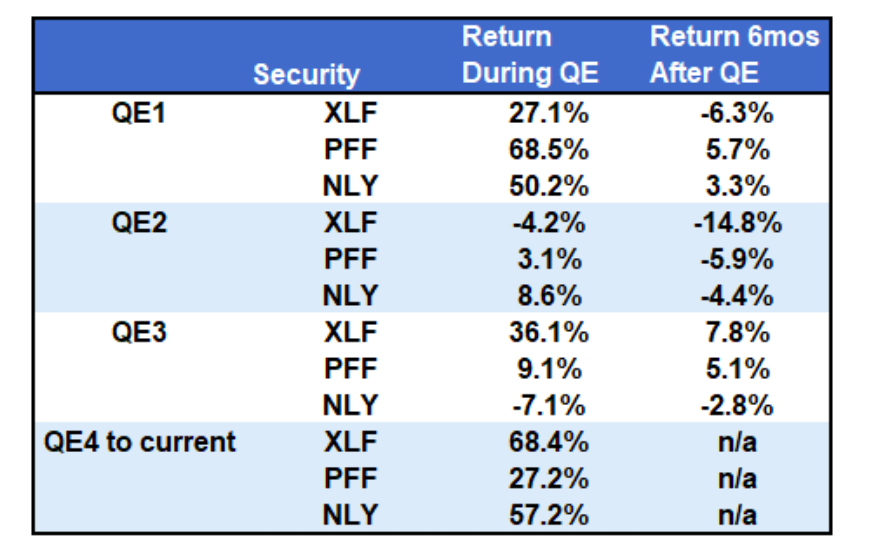
Profits and/or dividends for the three assets are sensitive to changes in the yield curve. While not concrete, the assets did better during QE when the yield curve was steepening. On average, the three assets gained 28% during each episode of QE. Their performance was not as robust when the yield curve flattened after QE. On average, they fell nearly 2% during the six months following QE.
When the Fed begins to taper or even get more serious about tapering, we advise caution with exposure to the three assets.
Inflation Expectations
Top of every investor’s mind these days is inflation. As such, it is worth sharing how market expectations for inflation changed during the four periods of QE.
As shown below, QE 1 was accompanied by a 3% spike in inflation expectations, albeit from negative territory. Likewise, QE 2 saw expectations rise while they fell during QE3.
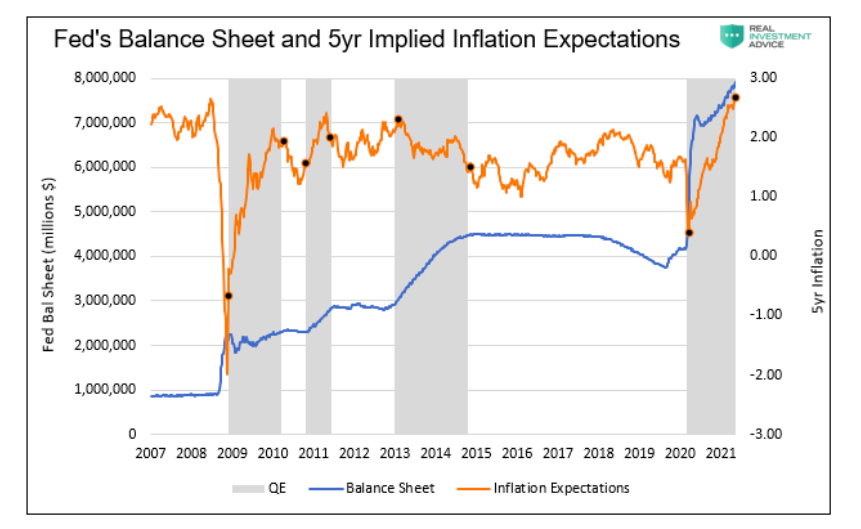
Thus far, during QE4, they spiked by about 2.50%, like QE1, but starting from a higher level. Of note, implied inflation expectations are now above pre-pandemic expectations. The QE1 spike in expectations failed to clear prior expectations.
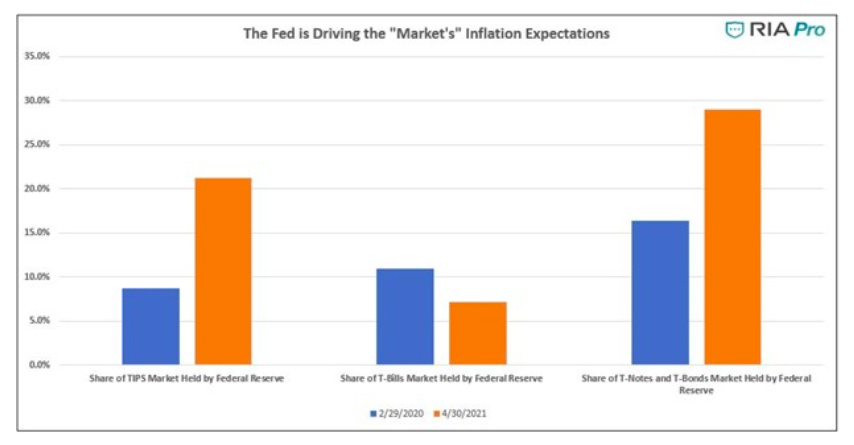
The Fed, via QE, makes this analysis incredibly difficult. As shown below, the Fed is an active buyer in the TIPs market, thereby distorting implied inflation readings. The indicator is not worthless, but it is flawed, making comparisons to the past more difficult. We offer caution when considering inflation expectations into your yield forecast.
Summary
We know it may sound crazy to stock investors when we say “fade the Fed.” The stock market has taught equity investors to buy when the Fed is buying and be careful when they are not. What stock investors may not know is the poor performance of bonds during QE and their strong performance afterward.
Bond investors should sell when the Fed is buying and buy when they are selling.
The Fed is potentially on the precipice of tapering their asset purchases. How they might accomplish that and when are big unknowns. However, it is coming, and there is a good amount of money to be made or not lost when the market senses the Fed is ready to change its tune.
Twitter: @michaellebowitz
The author or his firm may have positions in mentioned securities at the time of publication. Any opinions expressed herein are solely those of the author, and do not in any way represent the views or opinions of any other person or entity.

: Showing Some Signs of Emerging Strength")
