Today’s chart 2-pack takes a broad look at Gold and U.S. Equities.
Both assets appear destined for resolution soon. Could they be headed in opposite directions?
Perhaps so… if these technical patterns play out according to the script.
In the 2-pack below, we have a “monthly” bar chart for Gold and a “weekly” bar chart for the S&P 500 Index.
In the Gold chart, we have a bullish ascending triangle (point 1) and in the S&P 500 chart we have a bearish descending triangle (point 2).
These are long-term charts, so the resolution of these patterns will likely be important to investors. For Gold’s pattern to trigger a bullish signal, it would need to breakout over the resistance line of the wedge. And for the S&P 500’s pattern to trigger a bearish signal, it would need to break down below its lower support line.
Chart 2-Pack: Gold vs S&P 500
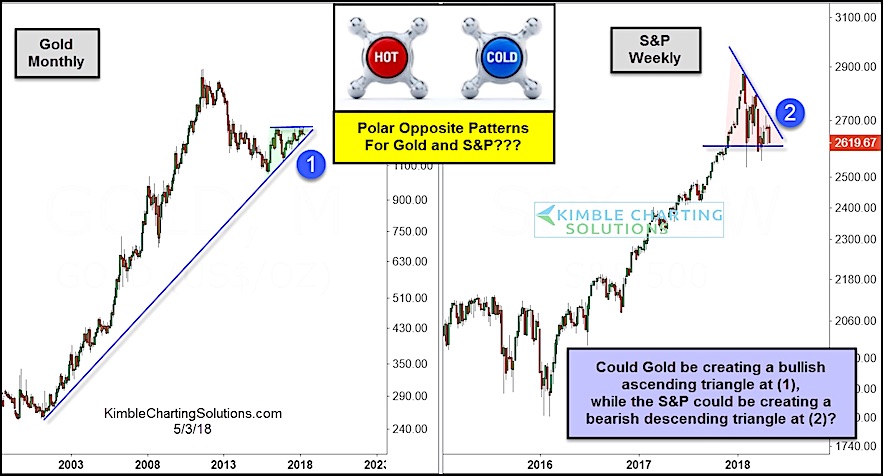
These patterns provide guideposts for investors. Although they tend to be bullish/bearish, they can go in either direction. For instance, the ascending wedge pattern for Gold would fail if it breaks the lower trend line. And the descending wedge pattern for the S&P 500 would fail if it breaks the upper falling trend line.
Stay tuned!
Note that KimbleCharting is offering a 30 day Free trial to See It Market readers. Just send me an email to services@kimblechartingsolutions.com for details to get set up.
Twitter: @KimbleCharting
Any opinions expressed herein are solely those of the author, and do not in any way represent the views or opinions of any other person or entity.


 Ready To Break Out?")