Gold bugs may need to step up to the plate. Although gold prices are surging, so is the Gold volatility index… and just as the metal hits resistance.
Since the December 3 price bottom at $1045.4, gold has rallied as high as 1263 on February 11. That’s just over 20 percent in 2 months time. Not too bad for an asset that just shed around 45 percent from its September 2011 highs (peak to trough).
That low has the potential to be an important low. But there’s still work to be done for gold bulls.
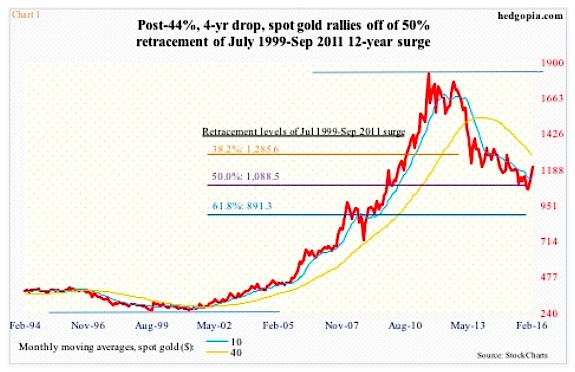
In July 1999, gold bottomed at $253.2 before starting a 12 year bull market run in which the metal surged over 750% before peaking in September 2011 at $1923.7.
A 50 percent retracement of that surge puts the spot at $1088.45, which is not that far away from the December 3rd low (see chart below).
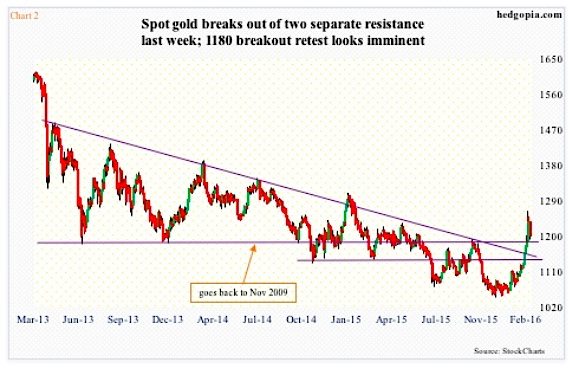
Come February, gold prices began to build on the basing action underway since December. Not only did it hurriedly take out the 200-day moving average but also $1180. Going all the way back to November 2009, bulls and bears have time and again dueled over this price point.
The problem in all this was that by the time the breakout took place, gold was pushed into deep overbought conditions and the gold volatility index surged. The daily RSI registered 88 on February 11. Whoa!
Similarly, a 38.2-percent Fibonacci retracement of the September 2011-December 2015 drop lies at $1214. Spot Gold prices spiked to $1263.9 on February 11th. That more than retraced 38.2 percent of that four-year decline, but fell short of retracing 50 percent ($1317).
A pullback is perfectly normal under these circumstances. It is a normal pullback if there is enough buying interest when a breakout retest occurs. The metal is fast approaching that level, and it has not even unwound its daily overbought conditions, not to mention weekly.
In the event that gold loses $1180, support at $1140 once again comes into focus, which also approximates the 200-day moving average ($1132). This would also test the trend line breakout (see chart below). All in all, a must-hold.
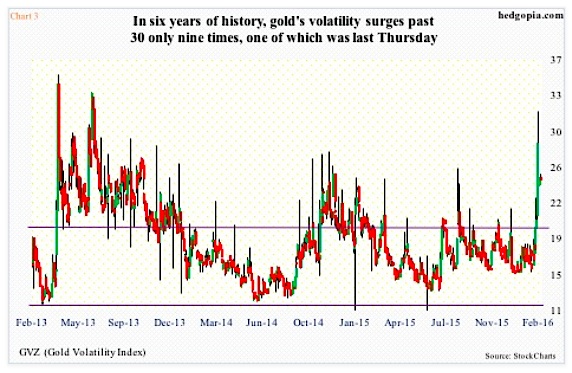
In its brief history of nearly six years, the Gold Volatility Index (GVZ) has surged past 30 only nine times, one of which was last week; on February 11th, it spiked to 31.60. The all-time high for Gold Volatility of 43.51 was recorded in September 2011, when the metal peaked. In hindsight, these north-of-30 spikes have been a good time to sell volatility/spot.
Looking at the far right of the chart below, it does look like gold volatility is itching to go lower from here. GVZ’s daily chart in particular is way overbought.
In this scenario, gold bugs would be hard pressed to defend $1180, and $1140 after that.
continue reading on the next page…


: Showing Some Signs of Emerging Strength")
