Since the presidential election, there has been relentless selling going on in the gold market. Last Thursday, I highlighted Gold as being oversold and a potential trading setup to watch.
Gold futures prices have fallen a bit further, demonstrating just how weak the yellow metal has been in November. One thing I stated last week that remains true now: “Have patience with this trade and wait for a buy signal on the weekly timeframe.”
If you’re gonna be early, it better be in smaller sizes.
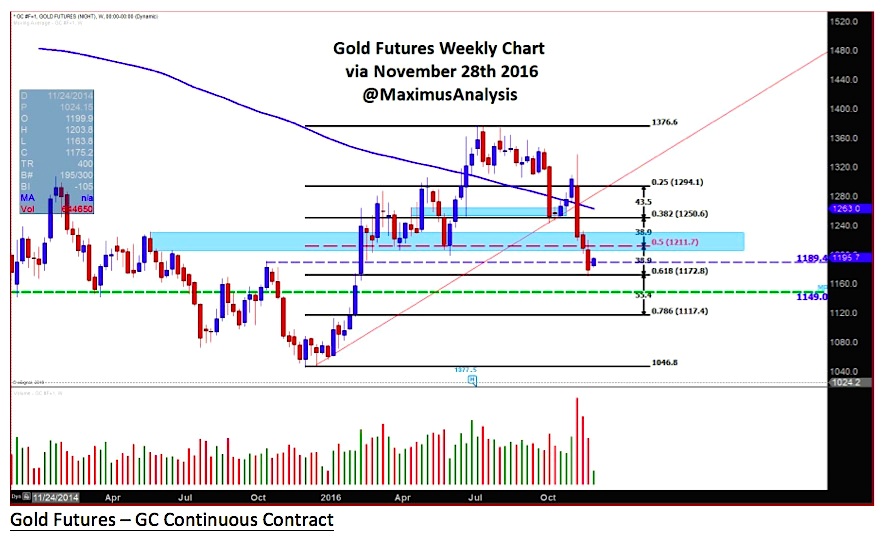
Gold Fibonacci Support Levels
Gold futures are in a critical support zone, between the 50 and 61.8 percent Fibonacci retractment levels. The chart below is from Monday trading – prices are now sitting right on the 61.8 Gold Fibonacci support level. Should the rubber band stretch even lower, we could see $1149 or $1117 prior to a bounce. But sometimes the rubber band snaps, so plan accordingly if you trade Gold (or want to trade Gold).
Here are the key levels highlighted in the chart below.
- Gold continued to hold the 50-61.8 % Fibonacci retracement area with oversold conditions.
- Key levels to watch are 1211.6- 1192.5.
- Upside price targets if Gold decides to bounce/rally:
- 1245.7
- 1271.1
- 1296.7
- 1323
Thanks for reading.
Twitter: @MaximusAnalysis
The author does not have a position in any of the mentioned securities at the time of publication. Any opinions expressed herein are solely those of the author, and do not in any way represent the views or opinions of any other person or entity.


