Precious metals prices have spent much of the past 2 years trading sideways… that is until recently.
And bulls have good reason to worry.
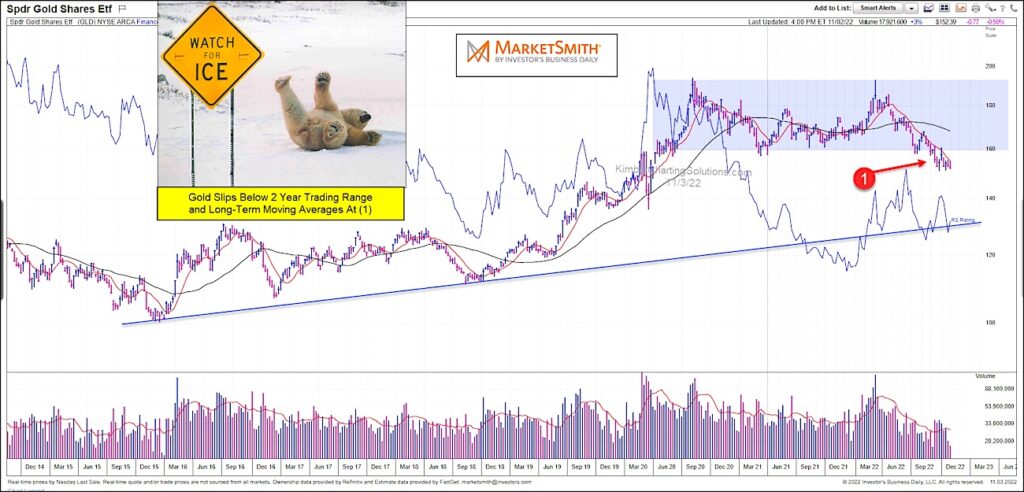
In the chart below, we take a “weekly” look at the Gold ETF (GLD) and highlight the latest setback. As you can see, price has fallen below the 2-year trading range and long-term moving averages at (1).
This break below dual support opens the door for further selling. The US Dollar has been awfully strong of late and this may be pressuring Gold prices (in USD terms).
Looking at the chart, I can tell you one thing for sure: Bulls are hoping $GLD doesn’t test its lower rising support! Stay tuned!
$GLD Gold ETF “weekly” Chart
Note that KimbleCharting is offering a 2 week Free trial to See It Market readers. Just send me an email to services@kimblechartingsolutions.com for details to get set up.
Twitter: @KimbleCharting
Any opinions expressed herein are solely those of the author, and do not in any way represent the views or opinions of any other person or entity.


: Important Breakout Retest")


