In our recent article, we looked at the strong seasonal tendency of Gold (GLD) to outperform during the month of January.
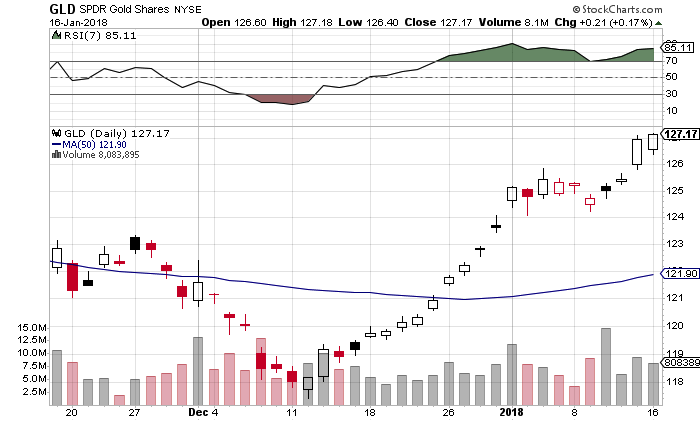
The Gold ETF (GLD) bottomed in mid-December and rallied almost continuously until the start of January, where it consolidated around the 125 level.
Since then, GLD appears to have resumed its upward movement, closing above 127. The RSI(7) has remained in bullish territory above the 70 level, a strong signal for the gold rally.
Though overbought, this indicates that the next pullback should find buyers.
Gold ETF – $GLD Chart (zoom chart)
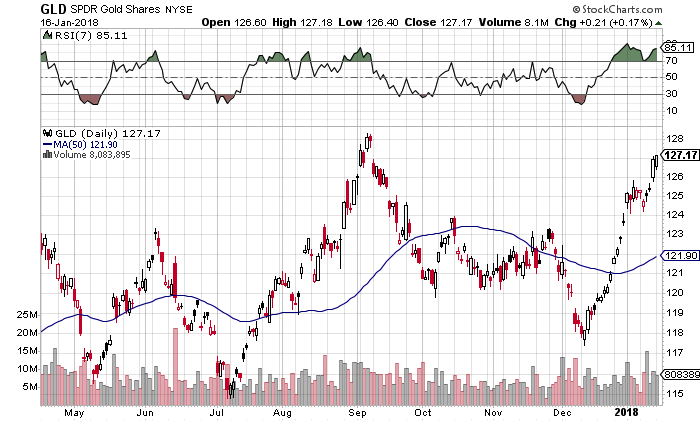
Look for a move towards the September high above 128. Continued US dollar weakness will serve as a tailwind for further price appreciation. Any equity weakness may also bring out the GLD buyers. With half of January in the books, there is still some room to run if we are going to see the typical 3.5% monthly gain (average over the past 10 years).
Gold ETF – $GLD Chart (wide angle)
Thanks for reading!
The author may hold positions in mentioned securities. Any opinions expressed herein are solely those of the author, and do not in any way represent the views or opinions of any other person or entity.

 Testing Important Price Support")
: Cup (and Maybe Handle) Watch")

