After a Fed-induced rally into October 2012, precious metals lost their luster, trending lower for much of the past 3 months. This price action has been particularly frustrating for Gold bulls, as many thought the previous move higher was set for continuation based on gold technical analysis.
It’s amazing to see how sentiment has changed in just a month or two. Now some pundits are wondering if Gold will need to take out the 2012 price lows before embarking upon a new leg higher. The metals are clearly soaked with uncertainty here, so an uptick in volatility is likely. Gold followers and investors would be wise to block out the noise and focus on the price action and inter-market corollary indicators (i.e. the US Dollar). Of course this is easier said than done, especially with another round of debt ceiling talks and political posturing lurking around the corner.
My thoughts: January will likely tell the tale. And Gold technical analysis and recent cycle analysis seems to confirm this… at least from a trading perspective.
With this in mind, here are three factors that Gold investors should be aware of over the coming days/weeks:
1. Gold Technical Analysis and Levels (in terms of GLD):
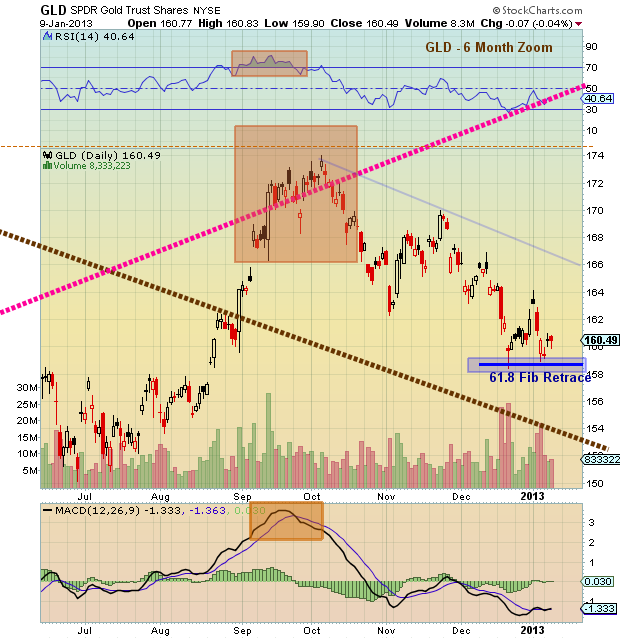
So, what levels should investors be watching now and how will investors know when the sparkle is about to return to Gold (GLD)? Well the answer to that question may largely depend on GLD’s ability to hang in and around the 61.8 Fibonacci retrace level (let’s call it $158). Note that this level was briefly touched in December. As well, a similar setup occurred at the same Fibonacci retrace level in April 2012… and resulted in a breakdown. With volatility sure to rise, investors may want to give GLD some intraday leash, or possibly apply a closing rule for exiting positions (note that this rule can be applied for re-entry as well). Gold technical analysis highlights lower supports at $155, followed by the 2012 lows.
Should Gold pivot higher, upside levels to watch include $164 (December breakdown and early January pivot), the upper channel downtrend line ($167 and falling), followed by $170 and $174. Either way, volatility is likely to pick up, so investors (long and short) would be wise to create a plan and manage risk accordingly.
2. The January Barometer:
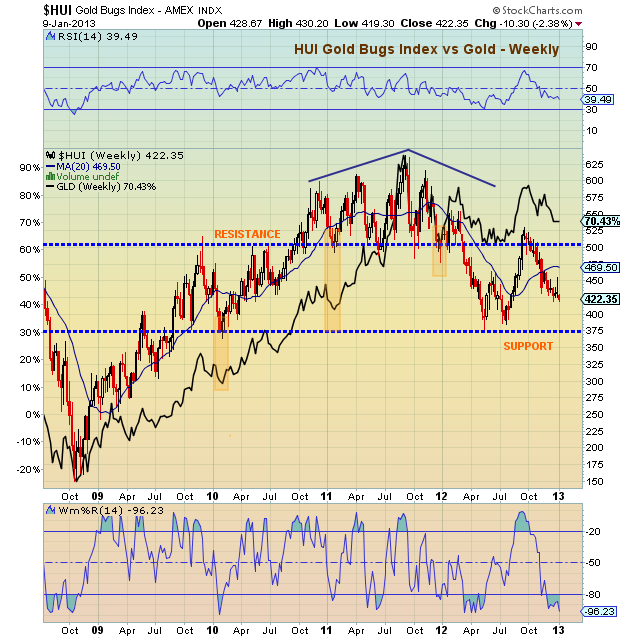
Each of the past 3 years have seen significant trading bottoms in or around January. And this year appears to be headed in that direction again. The Gold Bugs Index is extremely oversold and trying to stabilize. The index is also near it’s 61.8 Fibonacci retracement of the summer-fall 2012 rally.
3. The US Dollar:
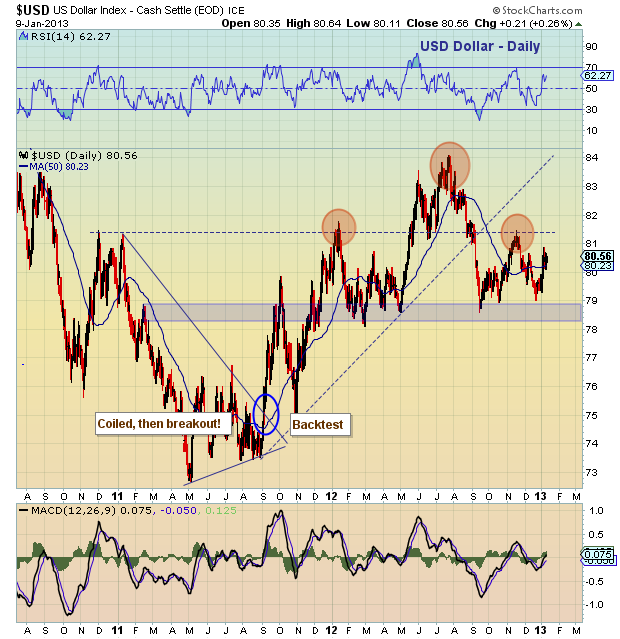
The Dollar is the wild card here. And as one of the best corollary indicators for the direction of gold, it bears watching. After rallying out of a nice rounded bottom in 2011 (which correlated with a topping pattern in Gold), the Dollar spent much of 2012 forming a Head and Shoulders pattern. A sustained break above 81 would foil the pattern and likely start a move higher for the dollar (bearish for Gold). However, a break below the 78-79 neckline level, and Gold will be in rally mode.
Other recent articles/notes of interest include Pragmatic Capitalism’s “Two Reasons to be Bullish on Gold,” wherein Cullen Roche highlights David Rosenberg’s 2013 bullish forecast. He points out that monetary expansion and stagnant gold mining production are at the heart of the bullish argument. Also see Minyanville’s “Gold Should Be Nearing a Major Bottom,” wherein David Bannister points to a late December/early January trading bottom.
Trade safe, trade disciplined.
Twitter: @andrewnyquist and @seeitmarket
No position in any of the securities mentioned at the time of publication.


