A little over a week ago, I put together a post on the outlook for Gold into year-end. What I found interesting about that piece was how skeptical and fragile Gold investors currently are (sentiment) as we continue on through what is typically a period of strong seasonality for Gold (Sept-Jan).
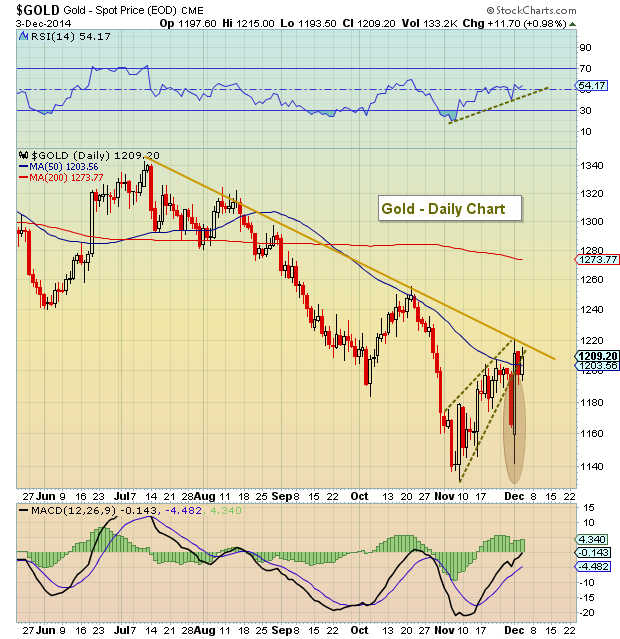
By no means was this indicating that a bottom was in, but rather that the market was ripe for a bounce. Sure enough, we saw a major intraday shakeout and reversal higher in Gold as prices dropped sharply (shakeout) before recovering with vigor (reversal) – see brown shading in chart below. This price action is especially important when sentiment is poor because it can shakeout the most weak hands.
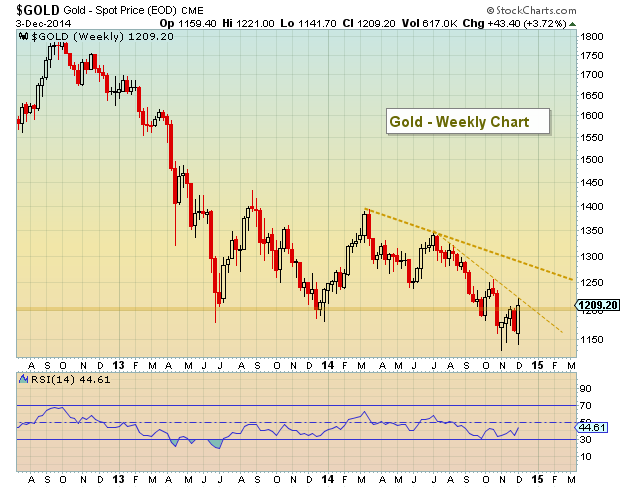
That said, let’s get on with the update and briefly discuss what the roadmap for higher prices looks like. As a reference point, please refer to the charts below. First and foremost, Gold MUST breakout above $1220 if it has a chance at $1260-$1270. $1220 represents the immediate downtrend resistance (you can see that on the Daily and Weekly Charts below). $1260 comes into play at the next downtrend resistance line and just above that is $1270 level near the 200 day moving average (currently $1273 and falling).
Lastly, the Daily chart shows a rising RSI that stayed in tact through the shakeout. As long as the recent lows hold, Gold has a shot to move a bit higher into early January (following seasonality).
Gold Spot Prices – Daily Chart
Gold Spot Prices – Weekly Chart
Follow Andrew on Twitter: @andrewnyquist
No position in any of the mentioned securities at the time of publication. Any opinions expressed herein are solely those of the author, and do not in any way represent the views or opinions of any other person or entity.


