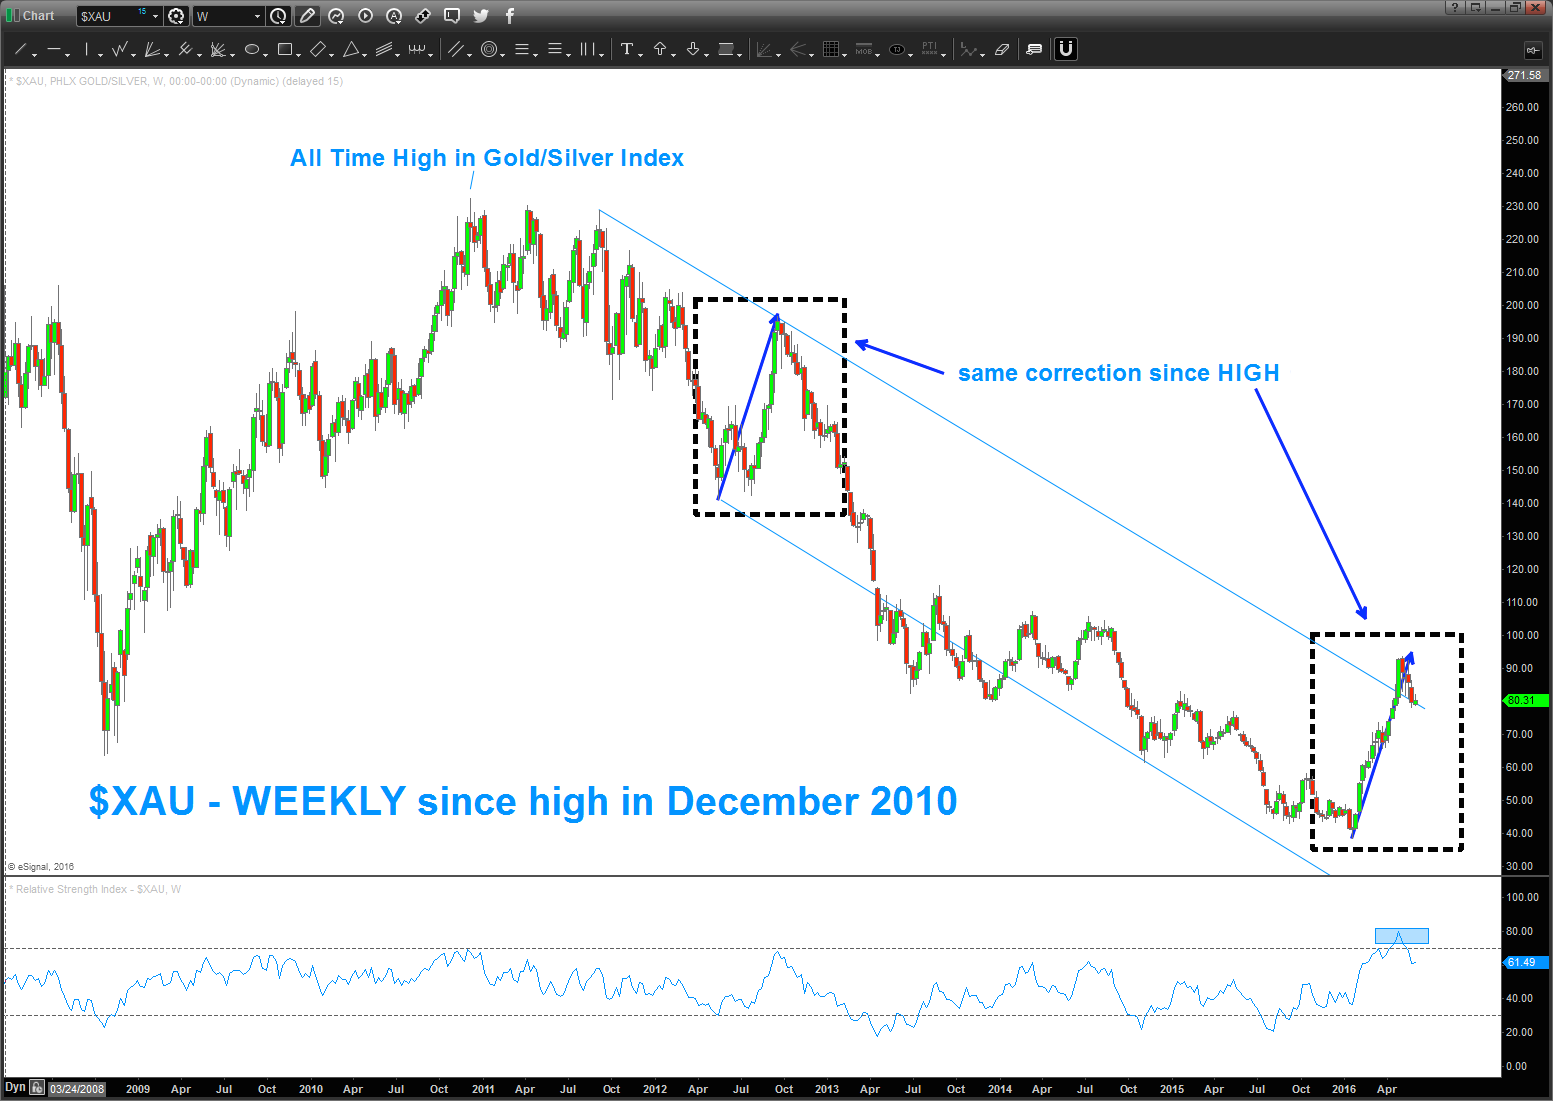
Since the high in the Gold Silver Index (XAU) in 2010 it has dropped considerably. Most recently, the index has rallied strongly BUT in the terms of this 6 year downtrend – we are once again at a crucial juncture.
As you can see, we have basically finished both a PRICE (exact) and TIME (somewhat) move higher… for the bulls in the group, breaking the long term upper trend line was definitely important. However, the “crucial juncture” is that the Gold Silver Index is about to complete a classic “outside return”. And, if polarity is working, the resistance of the down trend line should become support and off it goes.
There are a few concerns here though. Note the Relative Strength Index (RSI) indicator… we are the highest level on the RSI since the high was made.
What doe this mean?
With the measured move complete AND the RSI at it’s highest level since 2010, technically, one should expect a pullback here – perhaps more than expected.
I will continue to monitor the XAU for a potential BUY pattern but for now believe its best to step aside and do little with regard to Gold or Silver. It’s simply done over the near-term.
Gold Silver Index Chart (XAU)
Thanks for reading.
Twitter: @BartsCharts
Author does not have a position in mentioned securities at the time of publication. Any opinions expressed herein are solely those of the author, and do not in any way represent the views or opinions of any other person or entity.
: Creating Bullish Divergence?")


 and Semiconductors (SMH): Concerning Price Pattern?")


