The sun has been shining bright lately in south central Ontario and adding to that spike in serotonin from a healthy dose of vitamin D has been the healthy weight of element AU (gold) in our investment portfolios.
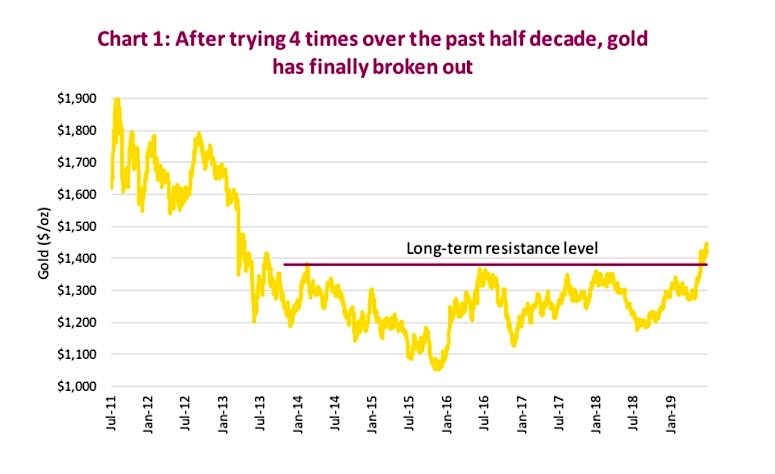
After several years of getting rejected at $1,375 an ounce, Gold (NYSEARCA: GLD) is undergoing a technical breakout.
The price rally has been aided by slowing domestic growth, trade tensions, a weaker U.S. dollar and lower relative carry costs. Robust returns lately have as garnered the interest of speculators, ETF buyers and industry participants. The move has been swift, making it hard to go overweight at this point, but we argue that there is always a place for the yellow metal in a diversified portfolio.
Chart 1 is a multi-year chart, which shows gold managing to break above a key resistance in June after many failed attempts dating back to 2014.
Following this key technical breakout, prices appear to be consolidating in the $1,400-$1,450/oz range.
As long as it can hold its recent price advances it looks like gold could easily go on a run. That old resistance level of $1,375/oz will remain very important going forward and may become a key support level.
FAANG meet BAANG
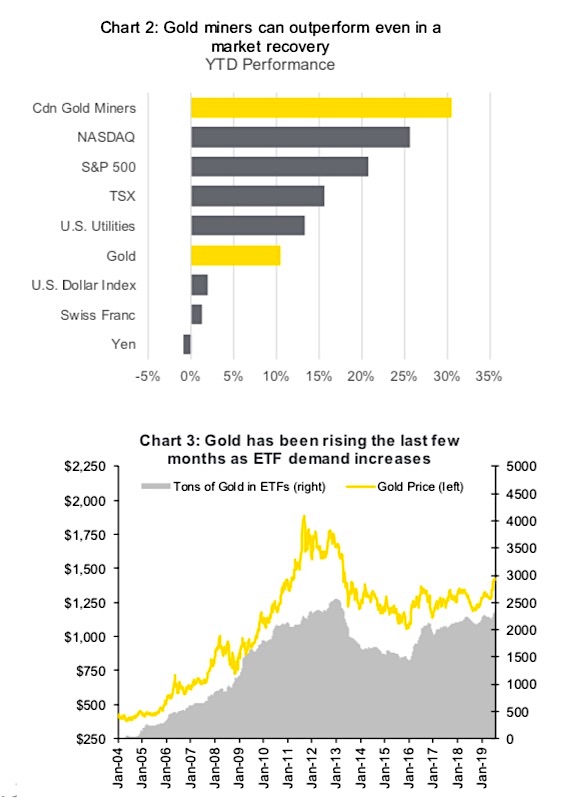
Everyone loves a new acronym. This week we came across one in a CNBC headline that caught our attention. Forget FAANG, look at BAANG. It certainly has a good ring to it. The underlying stocks are all gold companies, Barrick, AngloGold, Agnico Eagle, Franco-Nevada and Gold Fields. With big tech under the watchful eye of Congress and losing a bit of its mojo, perhaps it’s time for late-cycle gold stocks to take its place (ok, that is a stretch). In Chart 2, you can see that Canadian gold stocks have outperformed the NASDAQ, S&P 500 and TSX so far this year. Not bad, in a market environment that has been on a strong bull run.
Focusing on flow
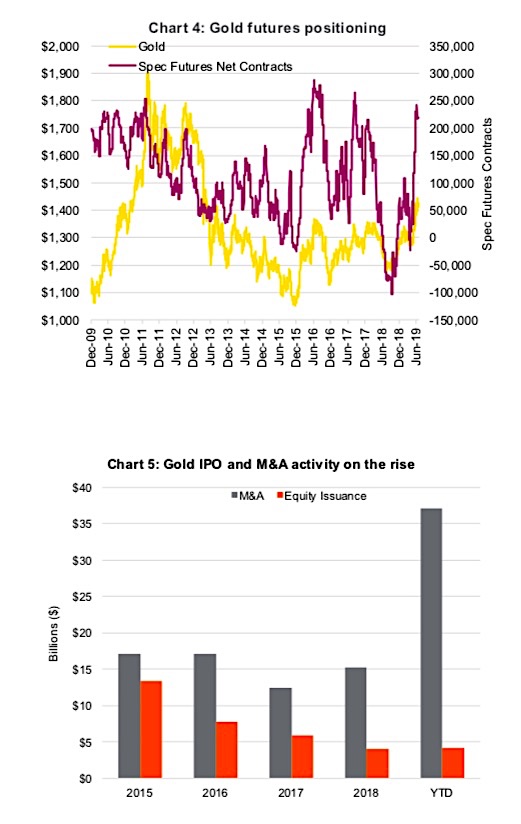
ETF demand has also been rising of late. Gold-focused ETFs have added 138 tons of gold so far this year (Chart 3). When you look longer term, the market is still underinvested compared with 2011-2013 levels. Sure, crypto currencies have likely taken some incremental demand from the market, but there is still a sizeable amount of capital in the market looking for a safe place to be parked; consider the $13 trillion in negative yielding debt worldwide.
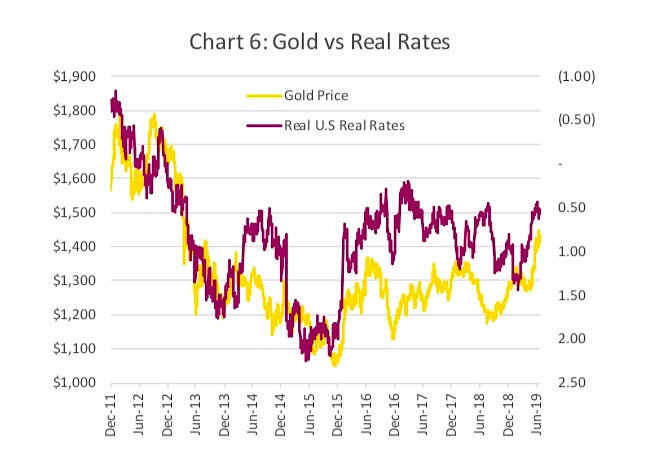
Looking at the futures market, it’s clear that hedge funds have been taking notice, piling into long contracts and drastically reducing the number of short contracts. The result is a net reading that is nearing extreme levels. Based on Chart 4, we would hesitate to say that this could be on its way to becoming a crowded trade. This chart goes back 10 years to give a better indicaiton of the massive swings in sentiment that the futures market can take.
Captial in movement
M&A activity has been on a tear this year in the gold space (Chart 5 above). We’ve seen mega mergers with Goldcorp and Newmont joining forces, in addition to the Barrick and Rangold deal. Globally, there has been a total of $37 billion of M&A activity. Bankers are busy on the deal side, but still not seeing much capital raising. This may change in the coming quarters, as strong equity returns certainly encourages miners to tap those equity markets for fresh capital.
More than just rates
Given the odds of a recession are on the rise, it’s no surprise that allocators of capital are shifting exposure to defensive options. One of the great arguments against gold is that it doesn’t pay any interest. True, but in a world of $13 trillion of negative-yielding debt, zero interest is still a positive carry compared with many other ‘safe’ investments. Falling bond yields tend to boost gold demand, but the real driver is real rates. Chart 6 plots real U.S. rates against the price of gold. If real rates move higher along with equities from accommodative monetary policy, but at the same time the dollar weakens, these forces could be offsetting, and gold could still move higher.
Central bank demand also continues to be strong. China has increased its monthly purchase of gold from 10 tons a month to 15 tons. It is by far the dominant holder of gold reserves, accounting for nearly 24% of global central bank gold reserves. Russia continues to be a large incremental buyer followed by Japan and Switzerland. With the U.S. Federal Reserve and the European Central Bank looking to lower rates, we might see more central banks turning to gold purchases for reserves as they shift away from U.S. Treasuries.
Investment conclusion
Market movers like American billionaire investor Ray Dalio have taken notice, pumping gold’s tires as a key defensive asset as the global markets undergo a “paradigm shift”. This paradigm shift may turn out to be more of a trading opportunity than a 10-year trend but gauging by the gold-to-stock ratio and eight years of underperformance, there is certainly room for gold to continue to shine.
In terms of our current positioning, we continue to hold a healthy overweight in our equity mandates, as well as a meaningful position in a gold miners ETF within our Managed Portfolios. Though gold may be showing some signs of being overbought at current levels, we will continue to hold it and highly recommend that investors take notice of any near-term pullback.
Source: All charts are sourced to Bloomberg L.P. and Richardson GMP.
Twitter: @ConnectedWealth
Any opinions expressed herein are solely those of the authors, and do not in any way represent the views or opinions of any other person or entity.


