A combination of events have served as catalysts for the recent rally in Gold spot prices. From looming budget talks and debt ceiling issues to European elections to a possible intervention in the Syrian civil war, the Gold rally has found a bid and pushed the price of the shiny yellow metal higher. But that said, these catalysts are all within the technical price construct and only serve to accelerate or decelerate price discovery within these bounds. Zooming in (and out) on the recent Gold rally, I’ll attempt to highlight some key resistance levels to watch for Gold, and its popular etf, the GLD.
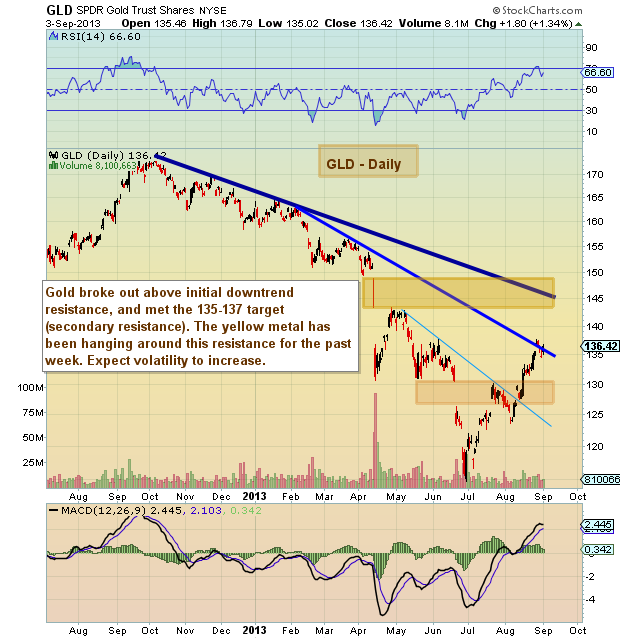
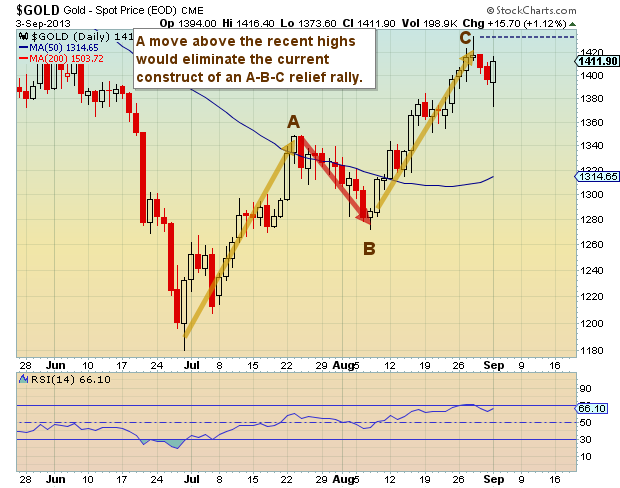
Three weeks ago, I provided a short-term roadmap for the Gold rally. Since then, Gold prices have hit my near-term target (secondary resistance) and begun to consolidate. This is highlighted in the first chart below: the SPDR Gold Trust (GLD) broke out above the initial downtrend line and rallied to secondary resistance. If it can get above this band of resistance, it may have eyes for $145. You can also see the A-B-C measured corrective move in Gold (on both the GLD and Gold Spot prices); I have highlighted this corrective pattern on the second chart). Bulls are hoping the Gold rally continues above the recent highs to negate this pattern.
GLD – Gold Daily Chart
 GOLD Spot Daily Chart
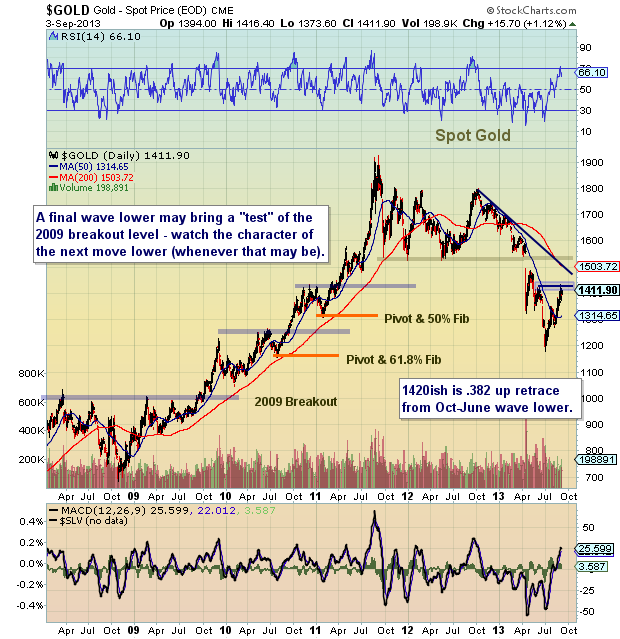
Turning to some longer-term charts, it’s apparent that Gold may be backtesting a key resistance intersection: where the downtrend line and broken uptrend line. On the weekly chart below, there is still room to run higher, however, should the Gold rally continue, investors will want to tune into the action around $140-$145 on the GLD. Looking at Gold Spot prices (the last chart), $1420 is here and now resistance, with the area to watch being $1440-$1480; $1525 being max near-term target.
GLD – Gold Weekly Chart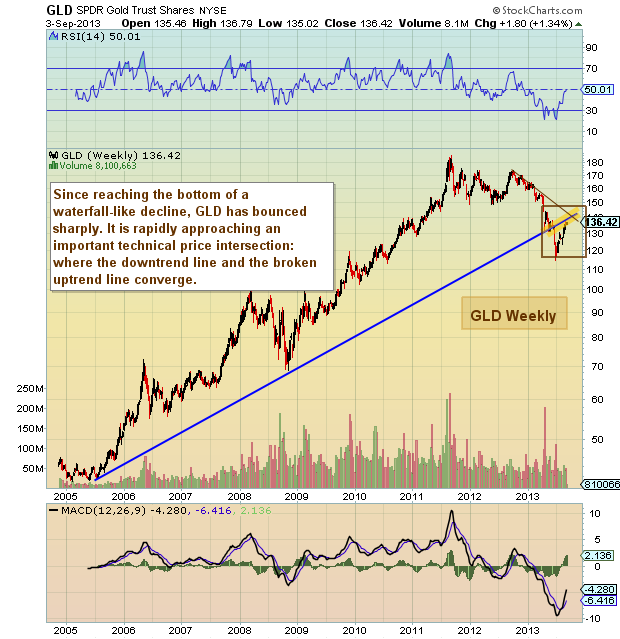
Gold Spot Price Weekly Chart
One last parting note: beware of geopolitical events/news. They can add a lot of noise/distortion and cause price head fakes (either way) that leave traders holding the bag. Thanks for reading. Trade safe, trade disciplined.
Twitter: @andrewnyquist and @seeitmarket
No position in any of the mentioned securities at the time of publication. Any opinions expressed herein are solely those of the author, and do not in any way represent the views or opinions of any other person or entity.


 Flirting With Critical Support… Again")
