 It’s been almost two years since Gold prices hit all-time highs, but for gold bulls those two years likely feel like ten years. Gold prices have dropped well over thirty percent, and many investors in the yellow metal are likely miffed.
True, the world still feels a bit dicey, and true as well that the Fed has remained easy. BUT time and price are always the final arbiters. And it is with this in mind that we turn to the charts to see where Gold prices are in the price discovery phase. And where Gold may rally to in the weeks ahead.
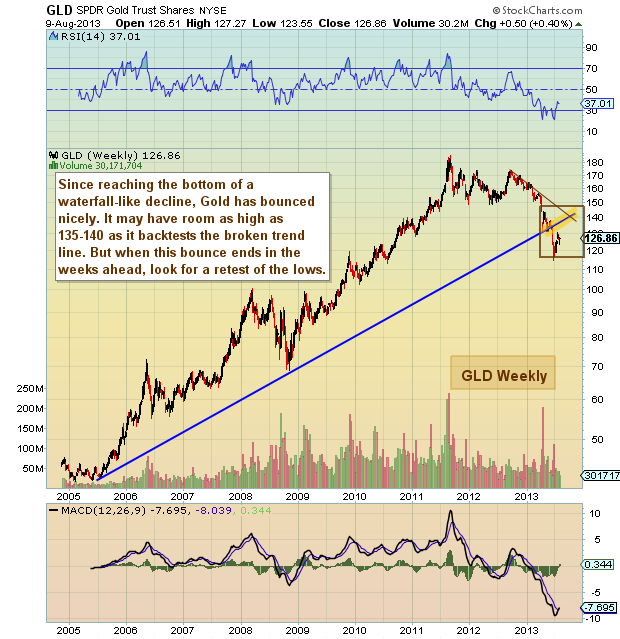
On the weekly chart for GLD (the Gold ETF), it is clear that the bull market trend line has been broken. This confirms the bear market status and likely means that Gold prices will need some time to stabilize. The major breakout occurred from around $100 on GLD (or just above $1000/oz). This is the level to monitor on the downside in the months ahead, should we see an undercut of the waterfall lows on a retest of the lows (most bottoms see a successful retest at some point).
But, wait, Gold prices have been rallying! And Gold is up big in pre-market today, suggesting a breakout above the light blue line in the daily chart below.
Also read: What’s Up With Gold Prices?
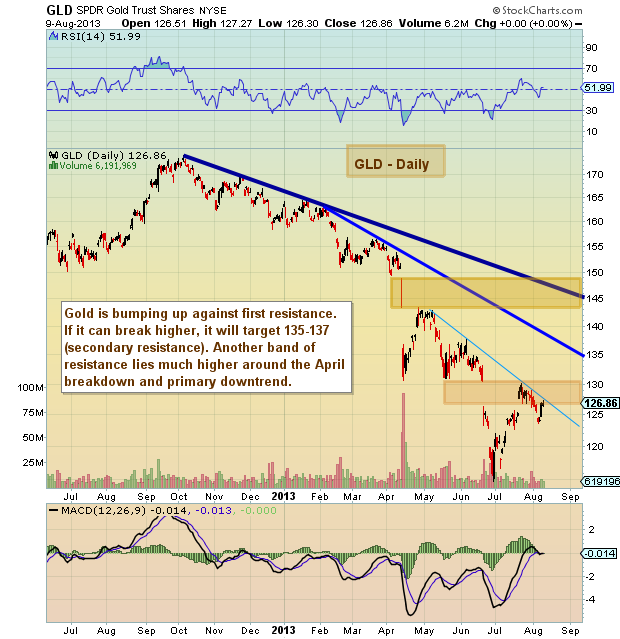
On the rally side of things, Gold prices could move as high as $1500/oz in the weeks ahead (or $145-148 on the GLD). But the first targeted resistance is the middle blue line on the Daily chart below ($134-$137). This is also the scene of the mid-June breakdown.
A combination of a firming US Dollar, firming confidence, and asset allocation competition (a flight to equities) have pushed gold prices lower over the past two years. BUT, with inflation returning to the radar, US debt ceiling talks coming up, and European elections around the corner, gold prices may yet have some legs rally.
Gold Prices — GLD Weekly Chart
 Gold Prices — GLD Daily Chart
Twitter: @andrewnyquist and @seeitmarket
No position in any of the mentioned securities at the time of publication.
Any opinions expressed herein are solely those of the author, and do not in any way represent the views or opinions of any other person or entity.
: Worrisome to Broader Market?")

: Important Breakout Retest")