The SPDR Gold Shares ETF (NYSEARCA:GLD) experienced a small pullback intra-week, taking cues from treasuries – I’ve noted before that the price action for gold has been closely tied to the action in the treasury market.
I provided an update here last week on the $TLT (20+ year treasury bond ETF). But back to gold…
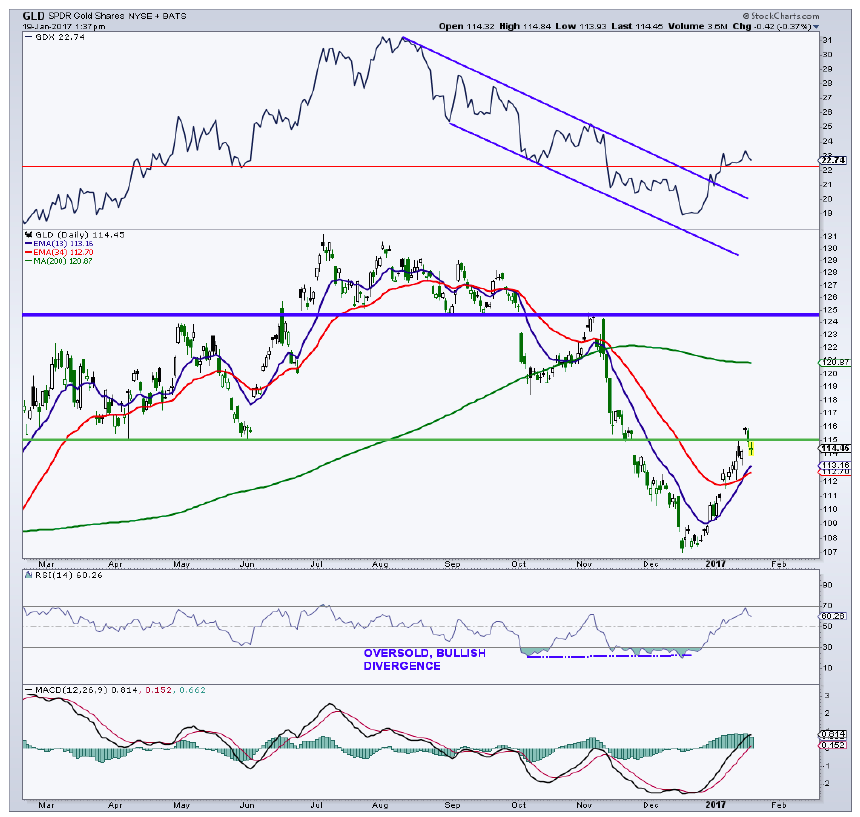
The Gold ETF (GLD) has so far paused right near chart resistance around the $115 level that I noted recently. Above $115, the next layer of chart resistance as well as the 200-day average sits in the 121 region.
On the downside, I do not expect the recent low (107) to get tested as there was terrible sentiment just a couple of weeks ago with some real panic on the way down. The COT data has finally reached bullish territory as commercial hedgers have decreased their net short position by over 200,000 contracts in recent months. At the same time, large speculators have sharply reduced their net long position.
SPDR Gold Shares ETF (GLD) Chart
Thanks for reading. Reach out to me at arbetermark@gmail.com for inquiries about my newsletter “On The Mark”, if interested.
Twitter: @MarkArbeter
The author has a position in GDXJ (junior miners ETF) at the time of publication. Any opinions expressed herein are solely those of the author, and do not in any way represent the views or opinions of any other person or entity.


: Showing Some Signs of Emerging Strength")
