Volatility and uncertainty have infected the financial markets as well as geopolitics. While unfortunate, it is the perfect environment for gold and precious metals.
And should today’s chart pattern prove correct, then gold prices may be headed much higher!
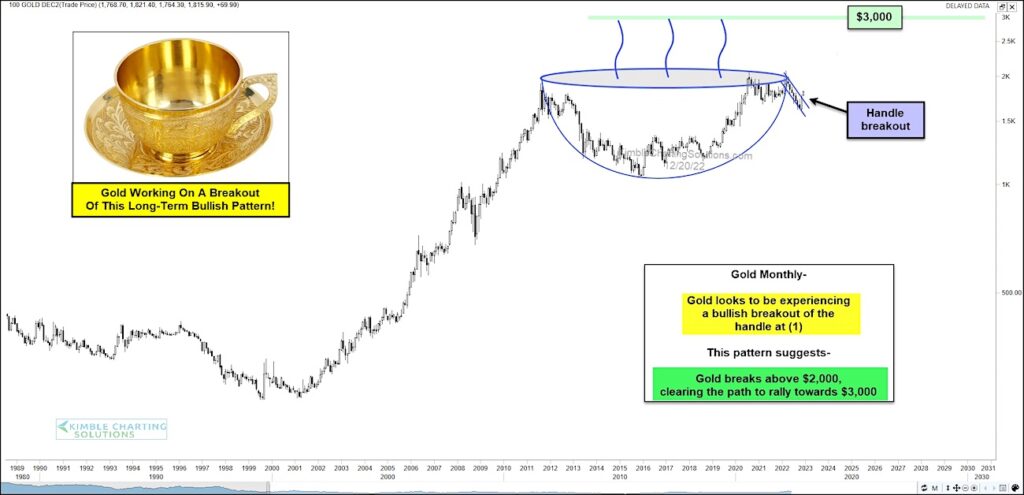
Below is an updated “monthly” chart of gold – note that we have shared this developing pattern several times. As you can see, gold has formed a long-term bullish cup with handle pattern.
AND this month it appears to be breaking above the handle of this pattern!
If/When Gold breaks above $2,000, it will clear the way for a rally towards $3,000. Wow! Stay tuned!
Gold Prices “monthly” Chart
Note that KimbleCharting is offering a 2 week Free trial to See It Market readers. Just send me an email to services@kimblechartingsolutions.com for details to get set up.
Twitter: @KimbleCharting
Any opinions expressed herein are solely those of the author, and do not in any way represent the views or opinions of any other person or entity.


