Gold prices and precious metals bulls have been biding their time.
While gold has traded sideways-to-lower, bullish investors have simple sat tight, waiting for a bigger move.
I have shared today’s chart pattern several times (read this article from over a year ago), but it seems important to update once again as we ask the question, “Is a big move nearing?”
“The facts, Ma’am. Just the facts.”
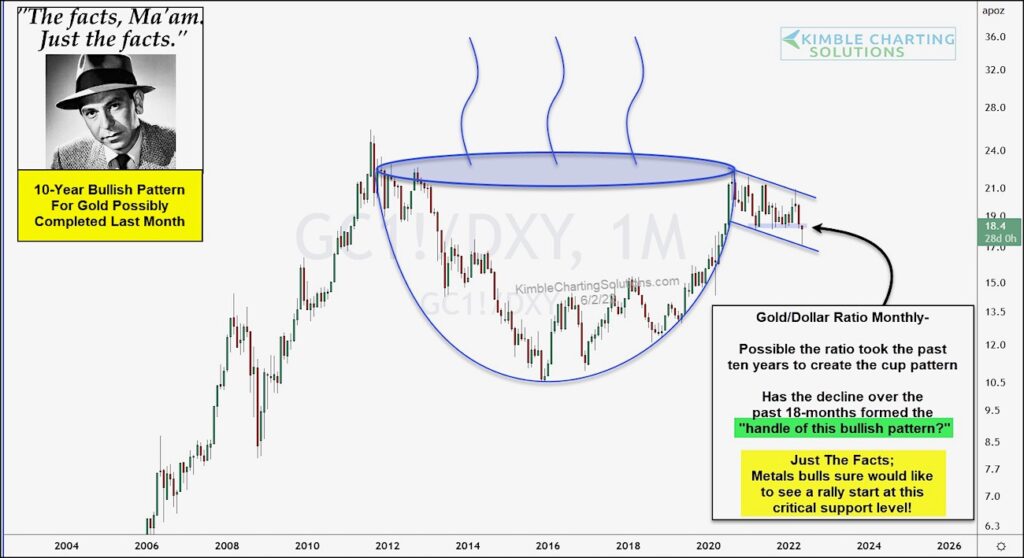
Looking at today’s chart, we will channel our inner Joe Friday to flesh out the facts. Below is a long-term “monthly” chart of the Gold / U.S. Dollar ratio.
After a sharp rise into 2011, this gold ratio declined sharply over several years… before bottoming and rising sharply into 2020. This formed a bullish “cup” pattern. And it appears the past 18 months may have formed the “handle”.
A bullish reversal pattern could be in play as Gold attempts to hold on to near-term support. Just the facts: Metals bulls sure would like to see a rally start right here! Stay tuned!
Gold / US Dollar Ratio “monthly” Chart
Note that KimbleCharting is offering a 2 week Free trial to See It Market readers. Just send me an email to services@kimblechartingsolutions.com for details to get set up.
Twitter: @KimbleCharting
Any opinions expressed herein are solely those of the author, and do not in any way represent the views or opinions of any other person or entity.
 Ready To Break Out?")


 Ready To Break Out?")
