Gold has been a very actively followed asset class the past two months.
From early August to early September, Gold jumped over 10 percent.
Since reaching $1566 on September 4, Gold has let its foot off the gas pedal. It is currently trading around $1510 at the time of this publication.
Active investors are now faced with an important question: Did Gold prices reach an intermediate top? Or is Gold simply trading in a bullish consolidation?
In today’s chart, we look at the “big picture”. This is a valuable exercise that all active investors should do… especially in today’s immediate gratification world.
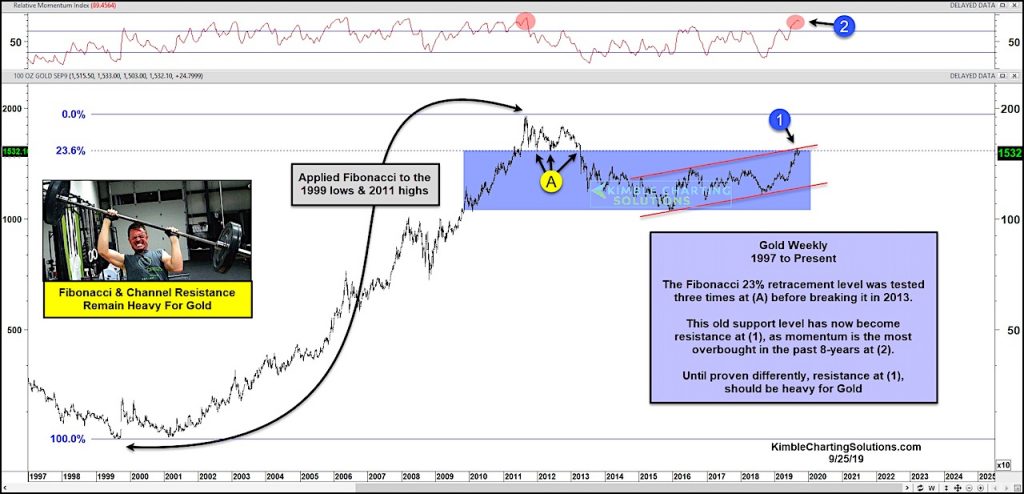
As you can see, Gold is testing a confluence of price resistance at (1) while momentum is the most overbought in 8 years (2).
The confluence of price resistance includes the old 23 percent Fibonacci support level (now resistance), as well as rising trend channel resistance.
So this is strong resistance… until proven otherwise. Stay tuned!
Gold “weekly” Price Chart
Note that KimbleCharting is offering a 2 week Free trial to See It Market readers. Just send me an email to services@kimblechartingsolutions.com for details to get set up.
Twitter: @KimbleCharting
Any opinions expressed herein are solely those of the author, and do not in any way represent the views or opinions of any other person or entity.
: Creating Bullish Divergence?")


 and Semiconductors (SMH): Concerning Price Pattern?")


