The golden opportunity for Elliott wave traders is catching the third wave in a sequence of five, because it’s usually the most powerful move of the sequence. The third wave can make for a good trade if your entry is well timed.
The market might be on the verge of seeing a downward third wave in the popular VanEck Gold Miners ETF, NYSEARCA: GDX. There’s a similar pattern developing for the actual metal, which we are also following.
Our current wave count continues with the basic forecast we published here in June 2021. Price found resistance where we expected, and the high we identified turned out to be just the first part of a more lengthy correction. There have been good trades in both directions in the year since then.
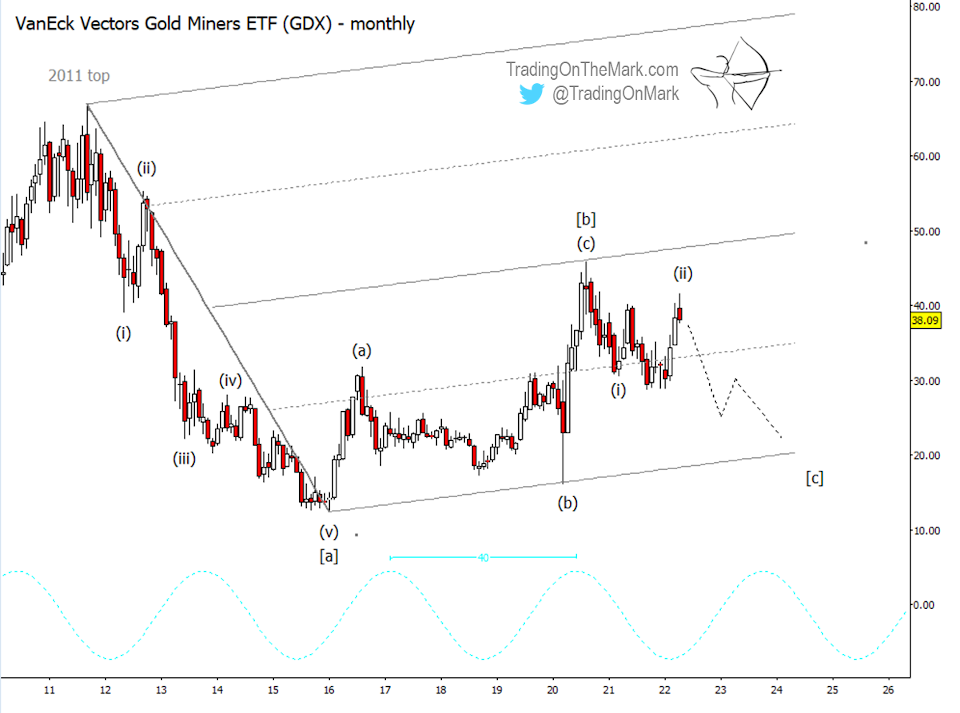
On a monthly chart, you can see how price was rejected near the middle of the range in 2020. We think that high represented wave [b] of a very long correction that started in 2011.
The price action during the past two years was the start of downward wave [c] which ultimately should consist of five sub-waves. If GDX has completed sub-waves (i) and (ii), then the chart makes for a nice bearish setup.
A weekly chart gives a better picture of how the trade might play out.
For this scenario to work, we want price to stay beneath 42.43. A break and weekly close beneath 37.57 can serve as initial confirmation of downward intent. There are some minor supports at 35.34 and 32.40 that might act as speed bumps on the way down.
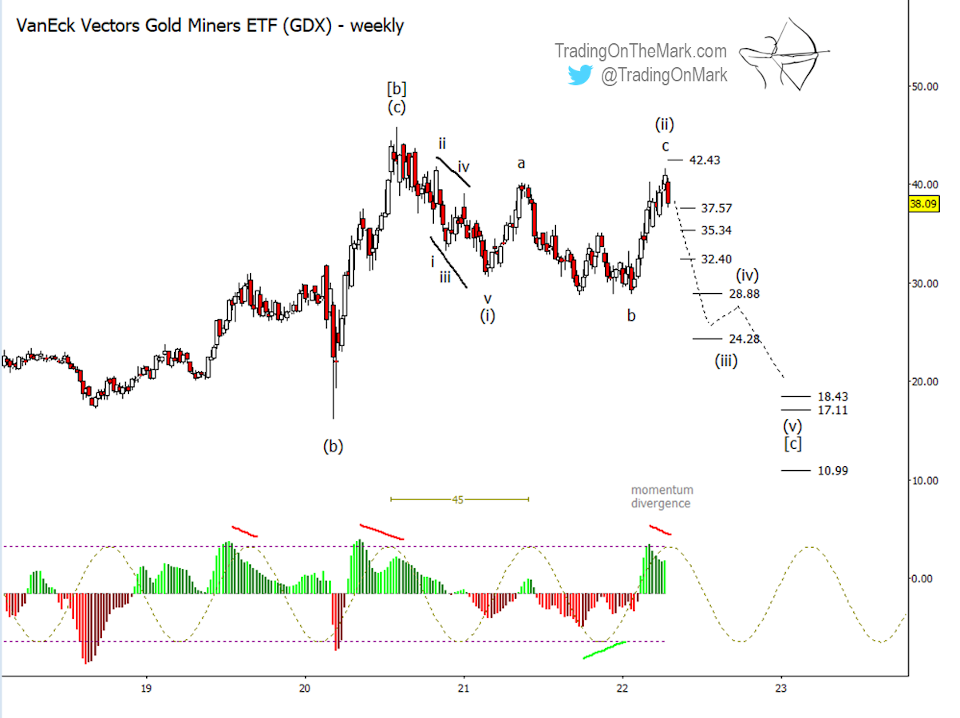
The first major support awaits near the areas of previous lows around 28.88, but 24.28 represents an even more inviting target for downward wave (iii) of [c].
Additional Fibonacci-based levels at 18.43 or 17.11 could mark the end of the entire wave [c], but there’s also a fallback support lower at 10.99.
The 43-week cycle and the 40-month cycle suggest potential timing for the lows of waves (iii) and (v) of [c] around autumn 2022 and spring 2025. However sometimes the highs and lows in GDX occur at the inverse points on the cycles, so we will continue monitoring the timing aspect. The 40-month cycle will crest in autumn 2023, so that represents a potential time for a low too.
Eventually, after wave [c] finishes, we expect a strong upward trend to develop that should last several years.
You can get daily charts and updates for this and other highly traded markets via our subscription page on Substack and on Twitter.
Twitter: @TradingOnMark
The authors may have a position in the mentioned securities at the time of publication. Any opinions expressed herein are solely those of the author, and do not in any way represent the views or opinions of any other person or entity.
")

 Testing Important Price Support")
")
