As a follow-up to our early April post about the VanEck Vectors Gold Miners ETF NYSEARCA: GDX, we wanted to alert readers that price has reached an important resistance area where a reversal is possible.
It’s worth noting that we have also updated our Elliott wave count slightly.
As we related in the earlier post, we’re looking for a multi-year downward impulsive structure to develop from the 2020 high in GDX. That would be consistent with GDX and the metal itself trying to complete the downward/sideways Elliott wave pattern that began back in 2011. A downward five-wave structure would be wave [c] of something – the conclusion of a decade-long structure that might be either a wave II or wave B.
Right now, it’s possible that sub-wave (ii) of the downward structure is ending, or at least pausing. Note that price has tested 40.10, which was the higher resistance level we showed in April and is also approximately a Fibonacci 61.8% retrace up to the 2020 high.
While the current area is a candidate for price to embark on downward sub-wave (iii), we also cannot rule out the possibility that sub-wave (ii) will require more time to develop. Thus current high area might represent just part ‘a’ of (ii). Another test of recent resistance at 40.10 or possibly even the next level at 42.00 is possible before price can break downward. Thus we have labeled the current high on the chart as sub-wave “(ii) or a of (ii)”.
Gold Miners ETF (GDX) Elliott Wave Forecast Chart
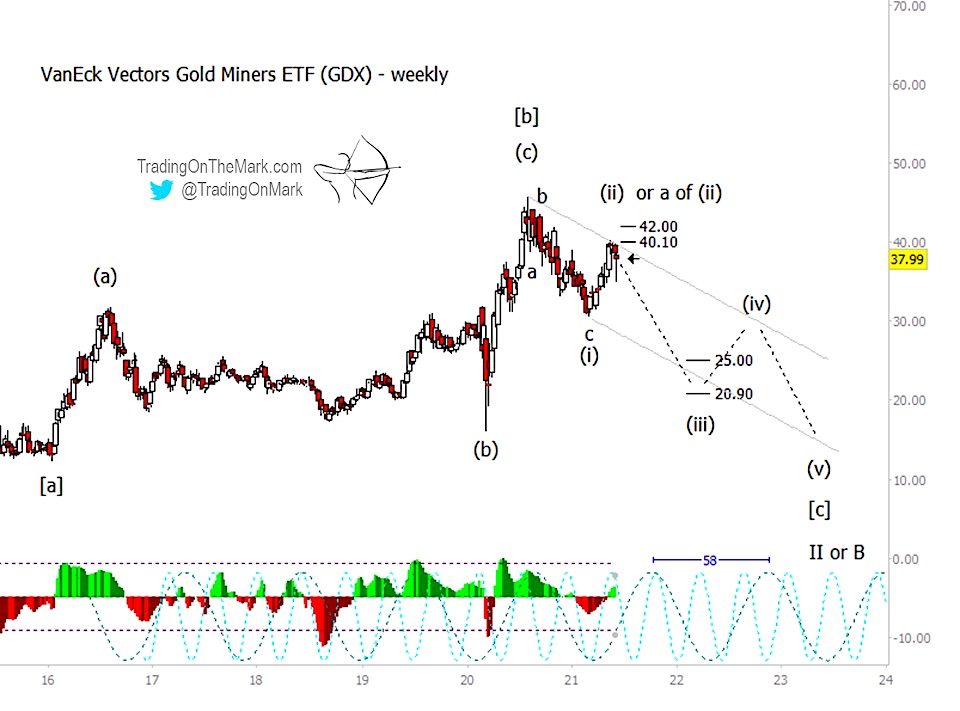
The weekly GDX chart above sketches out the possibility that the entire downward wave [c] might take the form of an ending diagonal. A diagonal-style overlap between sub-waves (i) and (iv) would allow the entirety of wave [c] to take on the “motive wave” decisiveness that’s needed in order to complete the larger corrective structure while also testing near the area of the previous wave [a].
Based on the 58-week dominant cycle – the slower of the two cycles shown on the chart – ideal timing for the lows of sub-waves (iii) and (v) would be in May 2022 and June 2023. Preliminary support areas for sub-wave (iii) include 25.00 and 20.90 based on Fibonacci extensions down from sub-wave (i).
Trading On The Mark provides detailed, nuanced analysis for a wide range of markets including crude oil, the S&P 500, currencies, gold, and treasuries. Sign up for free market updates via our new page on Substack and follow us on Twitter for more charts.
Twitter: @TradingOnMark
The authors may have a position in the mentioned securities at the time of publication. Any opinions expressed herein are solely those of the author, and do not in any way represent the views or opinions of any other person or entity.


