As a follow-up to our post last month about the gold ETF, we’re taking a look at the VanEck Vectors Gold Miners ETF NYSEARCA: GDX. The two funds often move in parallel.
For GDX and the gold ETF, we’re tentatively counting the decline from the 2020 high as the start of a larger downward impulsive move. In both cases, initial wave (i) counts best as a leading diagonal pattern.
Since GDX found support at 31.20, we consider that downward wave (i) might be complete. This is reinforced by the large candlesticks in this week’s rally.
The first resistance for an Elliott wave (ii) bounce sits nearby at 36.30. If price puts in a downward retracement from the current area, then we’d watch for it to find support fairly close to the wave (i) low – either above it or slightly beneath it. A typical retracement level to watch for that is 32.50.
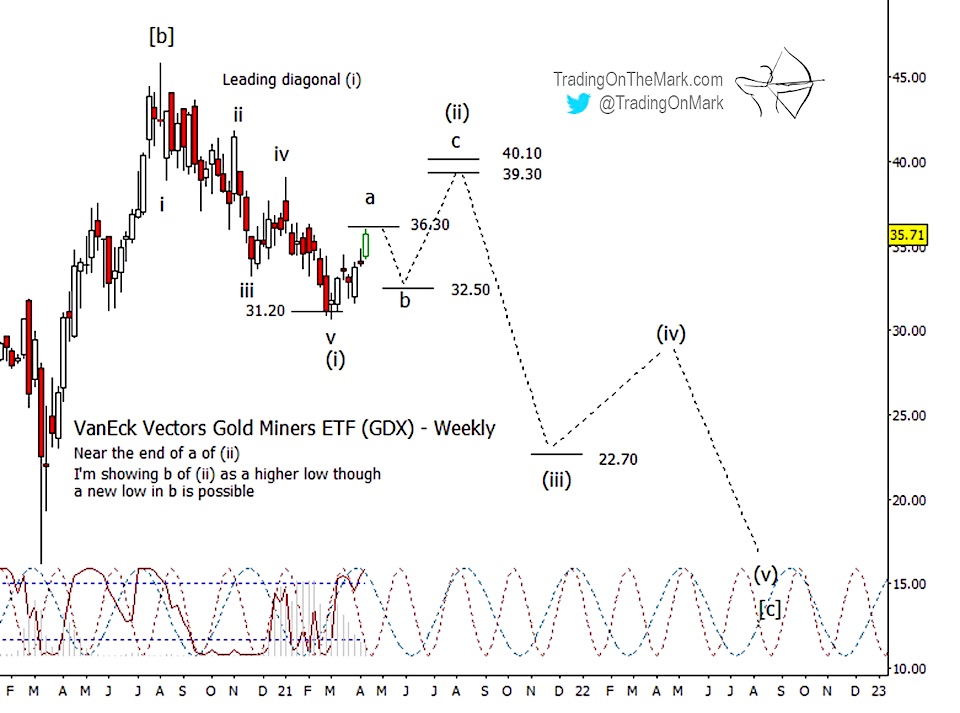
If GDX is able to overcome nearby resistance sometime during the next few months, then the next higher areas to watch sit near 39.30 and 40.10. That would present a more nicely proportioned wave (ii) in the downward sequence.
A very approximate area to watch as a lower stepping stone awaits near 22.70, although that level will be subject to refinement on future charts.
Trading On The Mark provides detailed, nuanced analysis for a wide range of markets including crude oil, the S&P 500, currencies, gold, and treasuries. Visit our new page on Substack and follow us on Twitter for more market updates.
Twitter: @TradingOnMark
The authors may have a position in the mentioned securities at the time of publication. Any opinions expressed herein are solely those of the author, and do not in any way represent the views or opinions of any other person or entity.


