In June we wrote about the bottom in oil and cannabis through USO and MSOS (ETFs) respectively.
In July we wrote about the potential top in NASDAQ and SPY.
In August, we wrote about the importance of the retail sector. XRT is below the July calendar range and a major reason the market is yet to make new highs.
All year, we have been on the inflation trade through agriculturals and energy.
Last week, Mish spoke about sugar futures on CNBN Asia and the barometer that it provides traders to gauge inflation.
Over the weekend, we wrote about the potential bottom in natural gas.
No inflation you say?
That -12% deflationary drag we saw in July CPI, which we saw only as a normal volatile correction in inflation, well that is all gone now.
So, what is next?
The metals seem to be languishing, almost not believing the longer-term impact of what oil and particularly sugar futures have done.
Today, we turn our attention to another potential widow maker perhaps ready to resurrect.
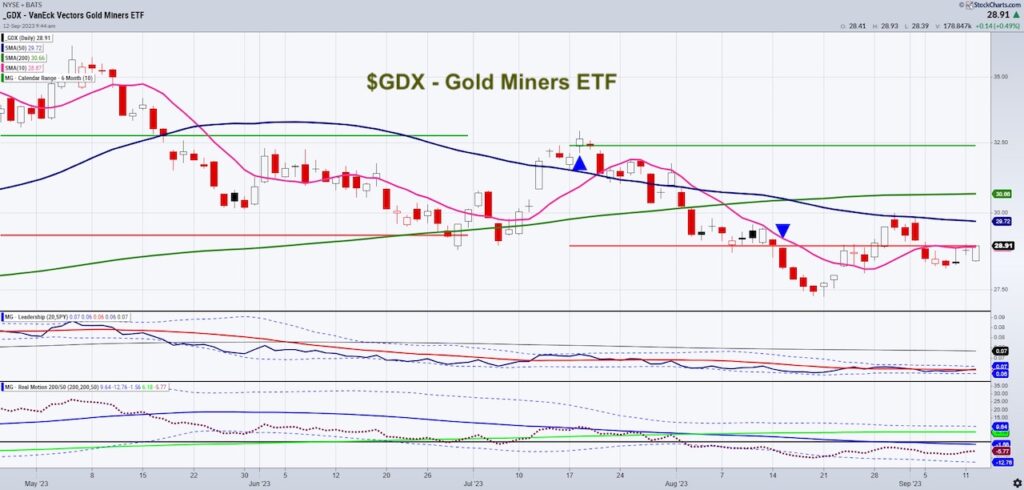
Gold miners (GDX the ETF).
GDX has been difficult to trade all year.
The ETF is a sell when it looks amazing and a buy when it looks horrid.
Top 5 holdings
- Newmont Corporation 9.95%
- Barrick Gold Corporation 9.01%
- Franco-Nevada Corporation 8.73%
- Agnico Eagle Mines Limited 7.54%
- Wheaton Precious Metals Corp 6.11%
Does GDX look horrid enough to consider a buy?
Our Leadership indicator shows GDX is beginning to outperform the SPY. If we are looking for more confirmation, we also want to see the Leadership blue line clear not only the red line, but also the Bollinger Band.
Our Real Motion indicator shows a mean reversion in momentum that happened in late to mid-August.
However, in a bearish phase along with price, we also want to see the red dotted line cross back over the 50-DMA (blue line).
On price, interestingly, the July 6-month calendar range low and the 10 Daily moving average align.
Recent highs could not clear the overhead 50-DMA now sitting at around 29.70.
With CPI coming on in the morning, this is one ETF that has our attention.
Twitter: @marketminute
The author may have a position in mentioned securities at the time of publication. Any opinions expressed herein are solely those of the author and do not represent the views or opinions of any other person or entity.

: Worrisome to Broader Market?")
