 By Andrew Nyquist While both the price of Gold and the Gold Miners ETF (GDX) peaked in September 2011 and again with a lower peak in July 2012, it is clear that the Gold Miners have taken the brunt of the recent gold complex pain. With Gold down roughly 20 percent from it’s 2011 peak, the Gold Miners ETF is down about 45 percent.
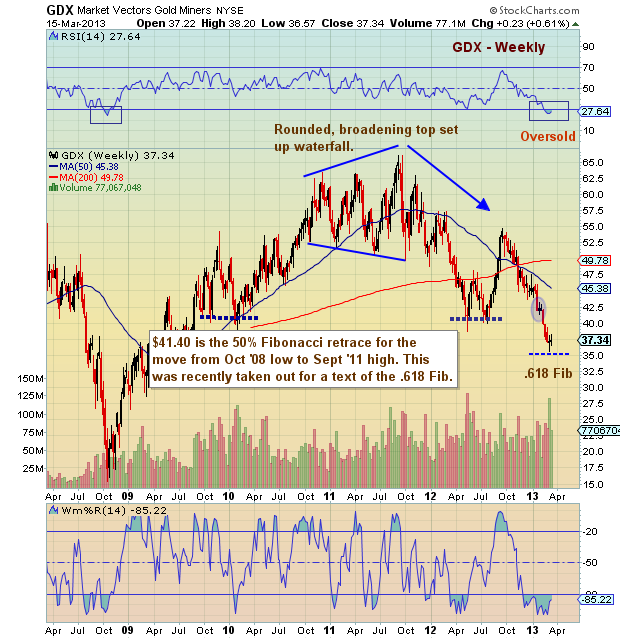
Consider this a quick follow up to my recent update on Gold. Looking back on the Gold Miners ETF, you can see the rounded, broadening top, followed by the swift fall to the 50 percent Fibonacci retracement level (of the ’08 to ’11 bull run). This produced a nice tradable bounce, but was merely a backtest of the breakdown. The drop from that lower high, has been steady, consistent, and painful to watch. It has lead to a drop below the 50 percent fib and a bounce off the 61.8 percent fib. This also coincides with a February flush and a deeply oversold RSI. See Gold Miners ETF – GDX charts below.
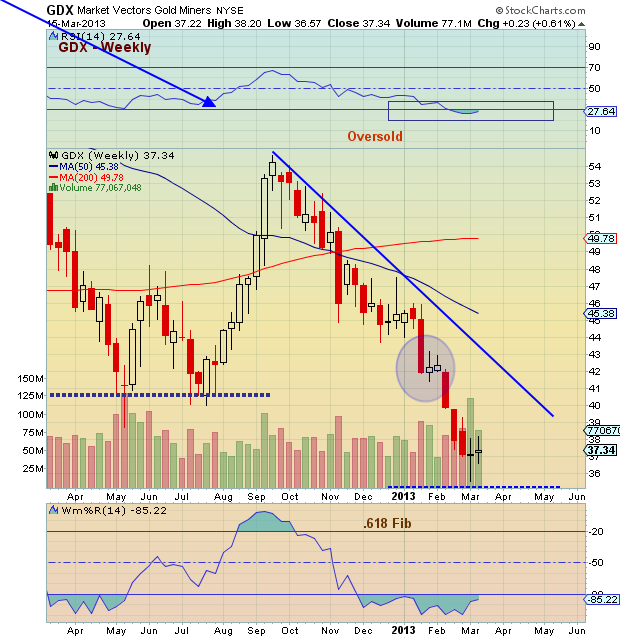
In the second chart, I zoomed in on the current downtrend. Support resides around $35, while resistance sits around $42. Ultimately, it wouldn’t be surprising to see a retest of the $41-$42 level. This is the old 50 percent fib and area where price began to accelerate downward in February. But, first things first, Gold Miner bulls need to stop the bleeding.
Trade safe, trade disciplined.
Gold Miners ETF – GDX Weekly Chart:
 Gold Miners ETF – GDX Zoom Chart:
Twitter: @andrewnyquist and @seeitmarket
No position in any of the mentioned securities at the time of publication.


