It is a crazy world out there right now. Slowing economies, war, political divide, and rising interest rates.
Seems the current setup would be a tailwind for Gold. But the price of Gold has really struggled this year, peaking in early March and falling slowly but surely over the past 6 months.
Today we take a step back and look at a longer-term “weekly” chart of the Gold ETF $GLD. This allows for some macro technical observations (price trend, price support/resistance, longer-term strength indicators, etc.)
Note that the following MarketSmith charts are built with Investors Business Daily’s product suite.
I am an Investors Business Daily (IBD) partner and promote the use of their products. The entire platform offers a good mix of analysts, education, and technical and fundamental data.
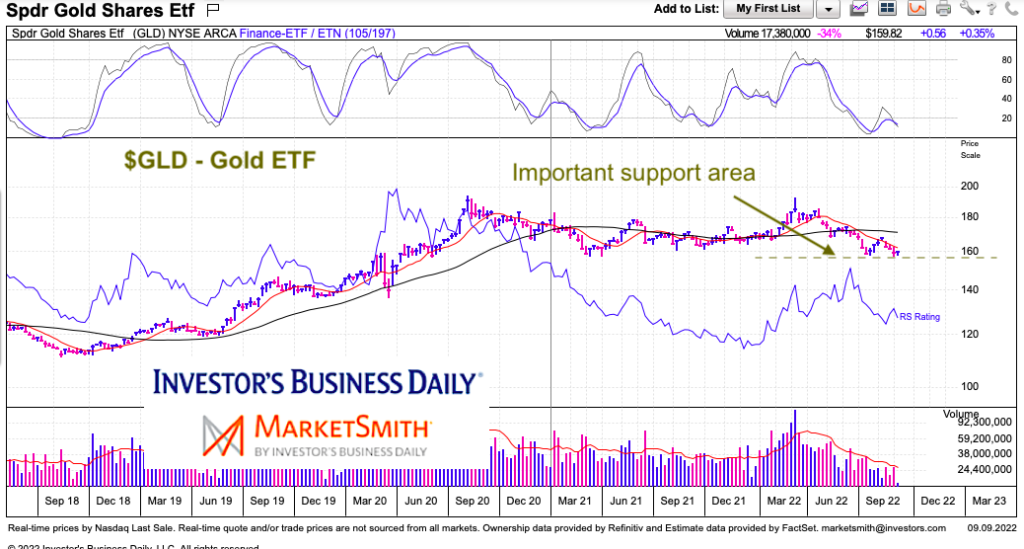
$GLD Gold ETF “weekly” Chart
Looking at the chart below, there are a few simple, yet important, takeaways.
The short-term trend is lower, the intermediate trend is sideways, and the longer-term trend is higher. Further, price is nearing an important support area. And a move to new 2-year lows would confirm the short-term bearish trend, while turning the intermediate trend down as well.
One other thing to watch would be a “fakeout” that quickly recovered back into the 2 year range. That would then need to hold to keep GLD rangebound.
Twitter: @andrewnyquist
The author may have a position in mentioned securities at the time of publication. Any opinions expressed herein are solely those of the author, and do not in any way represent the views or opinions of any other person or entity.

: Worrisome to Broader Market?")

