Depending on your timeframe, a chart can offer traders opportunity on both sides (long and short). That appears to be the case with Gold prices as tracked via the Gold ETF (GLD).
Gold prices have enjoyed a nice rally in 2016 and this has shown up in the trading chart of GLD. Today I’ll take a look at how GLD may be extended near-term, but set up nicely longer term.
Putting GLD into Perspective
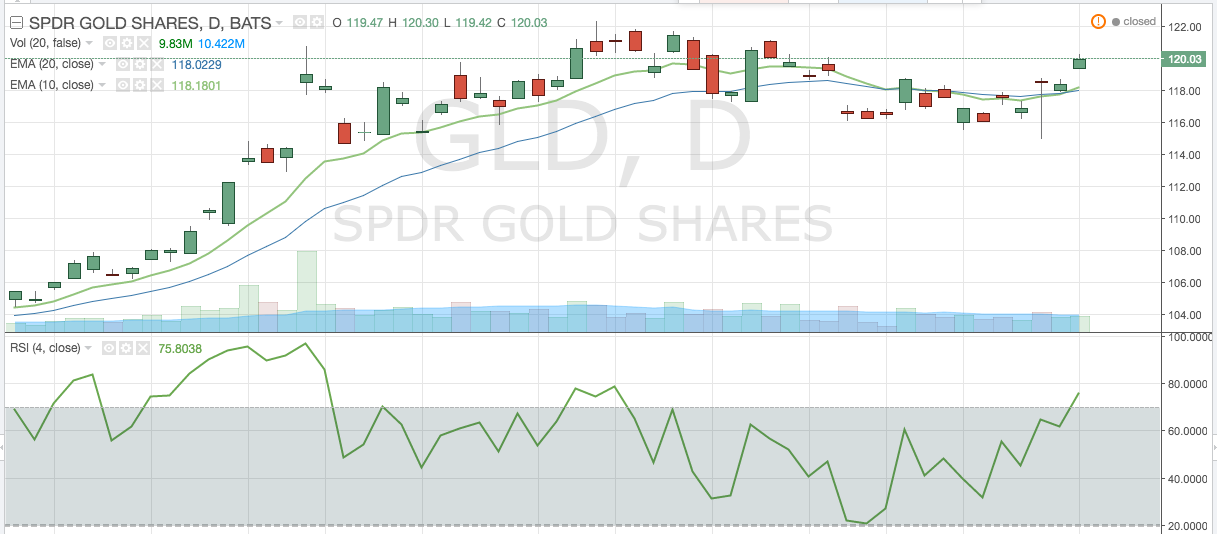
On a short-term trading timeframe, the Gold ETF (GLD) appears to be reaching short-term overbought trading levels as it heads into previous resistance at the 122 level. For reference, see its Relative Strength Index (RSI) in chart below. This appears to be a reasonable short-term short candidate, right?
Gold ETF (GLD) Near-Term Trading Timeframe
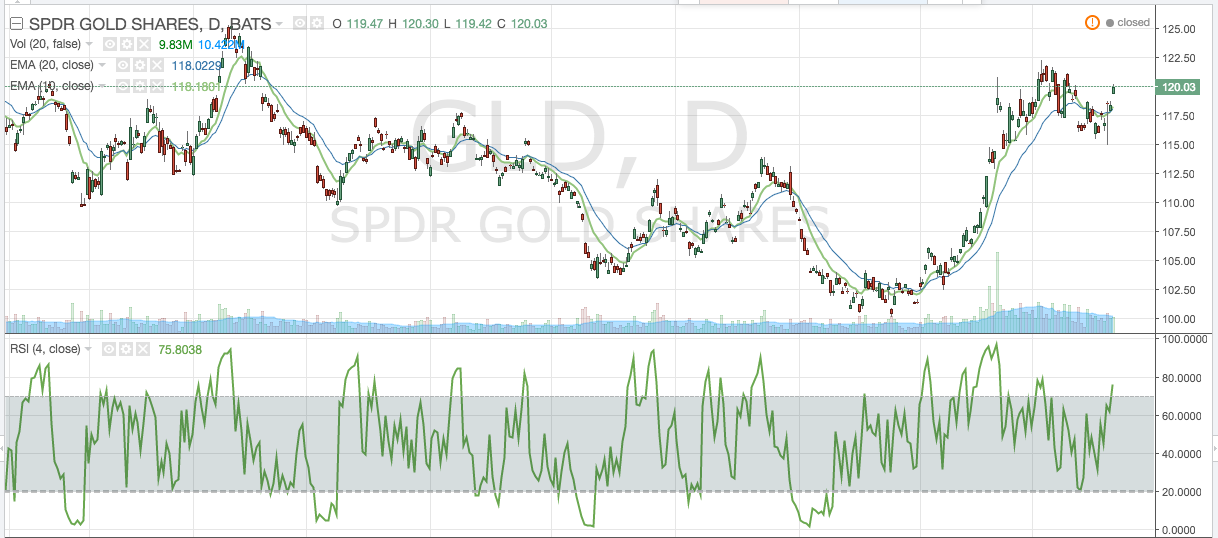
If we zoom out to a longer term view, it appears that GLD is developing what traditional chartists refer to as a cup and handle formation, complete with a low volume handle. Assuming GLD breaks out past the 122 level, it should be moving higher.
Gold ETF (GLD) Longer-Term Trading Timeframe
So which is it, a short candidate or pending long term breakout? It all depends on your trading timeframe…
Trade em well.
The author does not have a position in mentioned securities at the time of publication. Any opinions expressed herein are solely those of the author, and do not in any way represent the views or opinions of any other person or entity.
")


")
