Gold (NYSEARCA: GLD) attempted to break out above $1365/oz multiple times over the past year.
And the failure for Gold prices to cross that resistance level finally lead to another turn lower.
That move lower has been exacerbated by the recent strength in the US Dollar, and has rocked Gold bulls back on their heels.
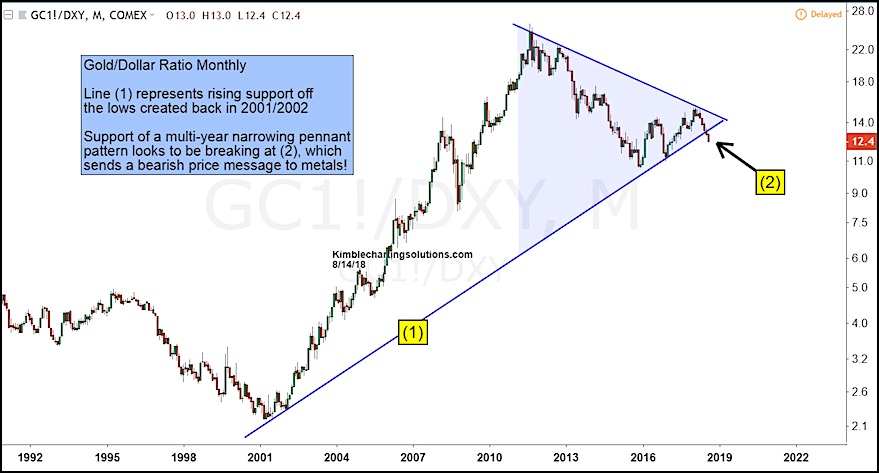
The ratio of Gold to the U.S. Dollar (NYSEARCA: UUP) offers domestic investors a good idea of where the trend is going.
In the Gold / Dollar ratio chart below, you can see the 17 year rising trend support (line 1).
The overhead falling trend resistance (top line) has caused price to compress in a multi-year narrowing pennant. And this compression recently lead to a move lower, that broke through support (point 2).
This breakdown is sending a bearish message to precious metals bulls.
Spot Gold Prices / U.S. Dollar Index Ratio Chart
Note that KimbleCharting is offering a 30 day Free trial to See It Market readers. Just send me an email to services@kimblechartingsolutions.com for details to get set up.
Twitter: @KimbleCharting
Any opinions expressed herein are solely those of the author, and do not in any way represent the views or opinions of any other person or entity.


