Gold came under selling pressure this week and has been in decline since peaking out in August.
That selling pressure, however, remained in a tight declining price channel for several weeks.
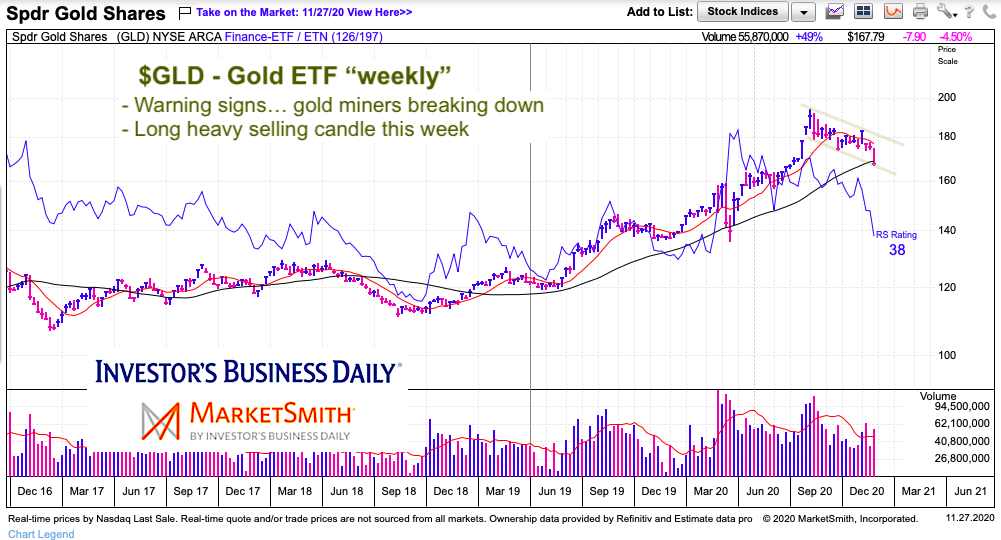
But warning signs are flashing as price could be set to breakdown in the weeks ahead UNLESS buyers step up now.
Today’s chart focuses on a common consolidation pattern that often results in continuation of the current trend… but sometimes gets “heavy” and topples over. Gold is at risk of that right now as the price of gold declined sharply this week and closed right on lower channel support.
Note that the following MarketSmith charts are built with Investors Business Daily’s product suite.
I am an Investors Business Daily (IBD) partner and promote the use of their products. The entire platform offers a good mix of technical and fundamental data and education.
$GLD SPDR Gold ETF Price Chart – “weekly” bars
I like to let my charts stand on their own. This chart shows the strong selling that occurred this week as the price of Gold (GLD) thudded to a confluence of near-term support (lower price channel support and 200 day moving average). It is also worth noting that the 50 day moving average is heading lower.
I definitely like the investing environment for gold right now, but the price action of late is concerning. And it comes after a big run for Gold in 2020. At a minimum, I’m looking for further consolidation before another rally higher. Trend-wise, it would be good to see gold firm up, and rally back over $180.
Twitter: @andrewnyquist
The author may have a position in mentioned securities at the time of publication. Any opinions expressed herein are solely those of the author, and do not in any way represent the views or opinions of any other person or entity.

: Worrisome to Broader Market?")

