 By Andrew Nyquist
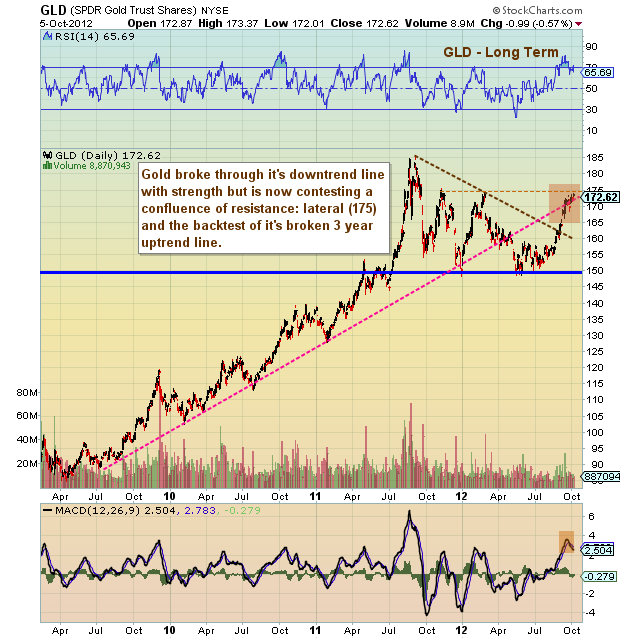
Consolidation is A-Okay with Gold (GLD) bulls. Or at least it should be. In fact, a quick low volume move lower may assist in recharging the engines for another run at the $175 level.
This area marks lateral resistance as well as a magnetic backtest of the previous bull move higher. A sustained break above 175 would likely lead to a retest of the 2011 highs.
Previous Gold chartology here.
More charts found here.
GLD chart with technical analysis overlay as of October 5, 2012. GLD Price support and resistance levels with trend lines. GLD technical analysis. Gold – precious metals.
———————————————————
Twitter: @andrewnyquist and @seeitmarket Facebook: See It Market
No position in any of the securities mentioned at the time of publication.
Any opinions expressed herein are solely those of the author, and do not in any way represent the views or opinions of his employer or any other person or entity.


