The price of Gold and the Gold ETF NYSEARCA: GLD have raced higher in August.
In fact Gold reached up as high as 1565 this week before falling back a bit.
The rally is being spurred by investors seeking “safety” from global trade and economic concerns, as well as a volatile stock market.
Today’s chart of the day highlights the Gold rally from a long-term perspective.
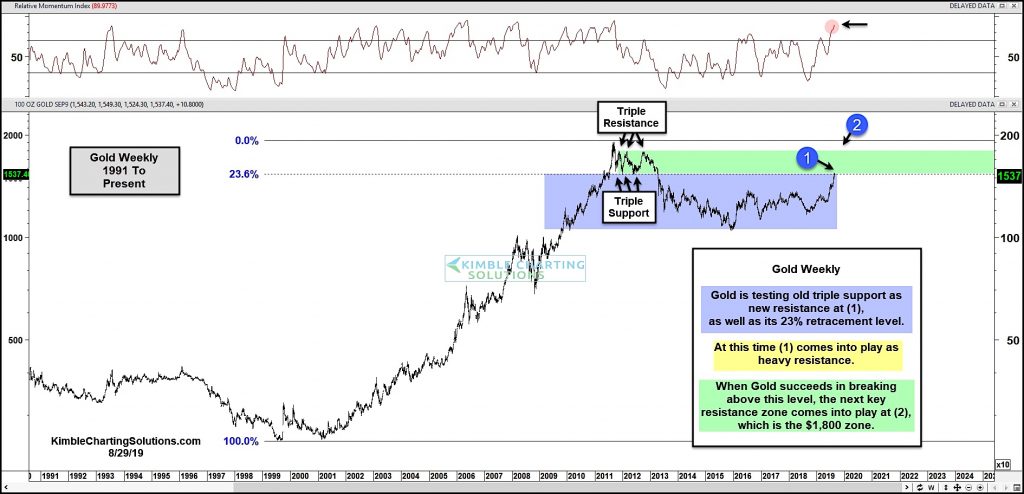
As you can see, Gold is testing an old price support level that is now resistance at (1).
This price area isn’t any ordinary resistance level: After gold peaked in 2011, it represented the 23.6% Fibonacci level and triple support.
So this is an important breakout test in gold. When gold succeeds in breaking out above this level, it will likely target the $1800 level at (2).
Stay tuned!
Gold Price “Weekly” Chart
Note that KimbleCharting is offering a 2 week Free trial to See It Market readers. Just send me an email to services@kimblechartingsolutions.com for details to get set up.
Twitter: @KimbleCharting
Any opinions expressed herein are solely those of the author, and do not in any way represent the views or opinions of any other person or entity.

: Worrisome to Broader Market?")

