Gold prices remain elevated as inflation, political differences, and the prospect of international war radiate on the horizon.
This prospect of uncertainty tends to be where gold finds buyers at higher prices.
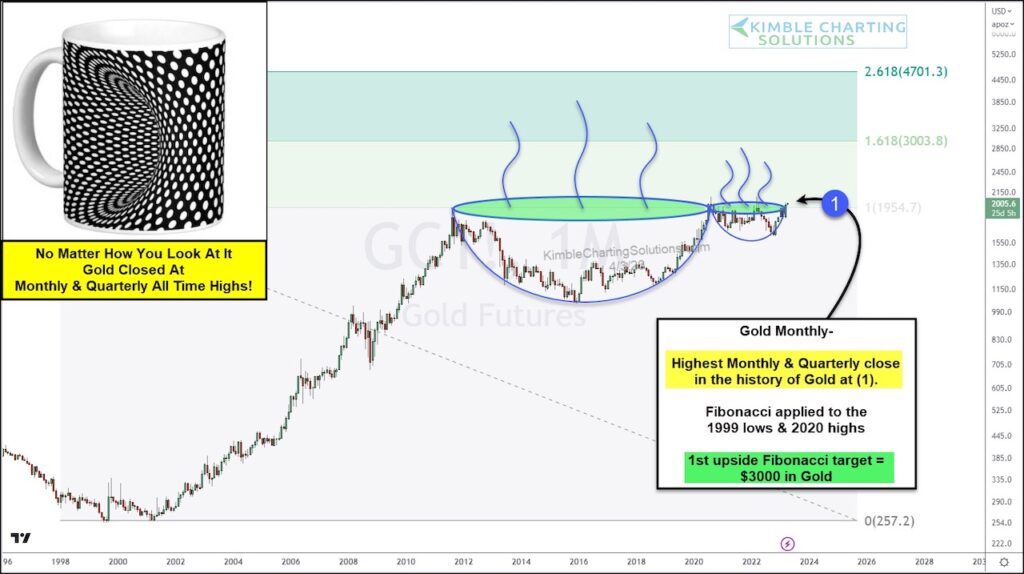
Today, we revisit a pattern that we have highlighted several times over the past 5 years: The cup with handle.
Below is a long-term “monthly” chart of gold highlighting the pattern. Note that just last month, gold closed at monthly and quarterly all time highs at (1).
This has gold bulls quite eager to see if this is the major breakout they have been waiting for. If so, the first upside price target (1.618 Fibonacci level) is at $3,000. That level is nearly 50% higher. Stay tuned!
Gold “monthly” Price Chart
Note that KimbleCharting is offering a 2 week Free trial to See It Market readers. Just send me an email to services@kimblechartingsolutions.com for details to get set up.
Twitter: @KimbleCharting
Any opinions expressed herein are solely those of the author, and do not in any way represent the views or opinions of any other person or entity.


