Last year’s rally in the price of Gold brought renewed excitement to gold bulls (and gold bugs).
And it all makes sense…
A pandemic, political unrest, and lots of money being handed out.
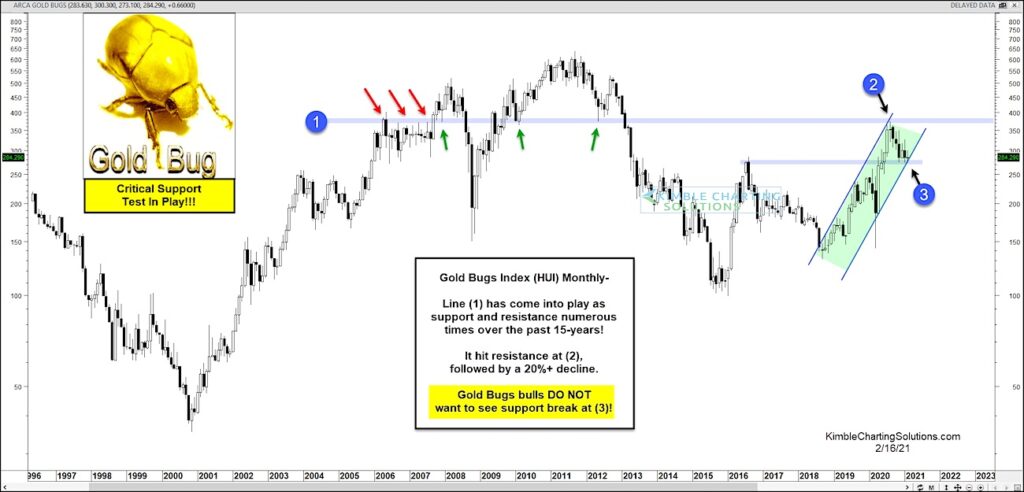
But Gold fizzled out in late fall after a big rally. And it’s been trading sideways to lower ever since. This shows up in the today’s long-term “monthly” chart of the Gold Bugs Index (HUI)… we saw a big rally hit a long-term support/resistance line at (1) and reverse lower at (2).
This reversal lower, though, is within a near-term bullish up-trend channel. And $HUI is now testing its up-trend support line at (3), along with lateral support (marked by its 2016 highs).
Gold bugs DO NOT want to see a break of price support at (3). Such a breakdown would be bearish for gold prices. Stay tuned!
Gold Bugs Index (HUI) Chart
Note that KimbleCharting is offering a 2 week Free trial to See It Market readers. Just send me an email to services@kimblechartingsolutions.com for details to get set up.
Twitter: @KimbleCharting
Any opinions expressed herein are solely those of the author, and do not in any way represent the views or opinions of any other person or entity.


")