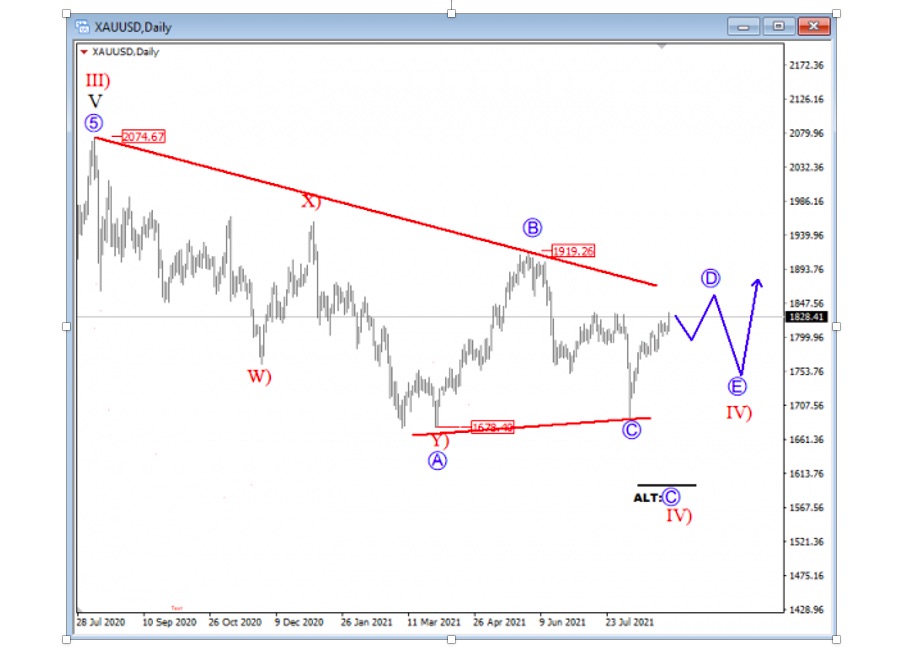
After testing its all-time high of 2075, Gold is once again coming lower.
Although this higher degree correction from last year is still underway, there are hints at when and where it will come to an end.
Today, we will discuss two possibilities for wave four. A triangle is still one of them as current leg/spike down can be seen as wave C.
The second possibility is a deeper wave C, to around 1600 if 1678 is broken, as part of alternate (ALT) Elliott wave count.
Gold “daily” Elliott Wave Analysis Chart
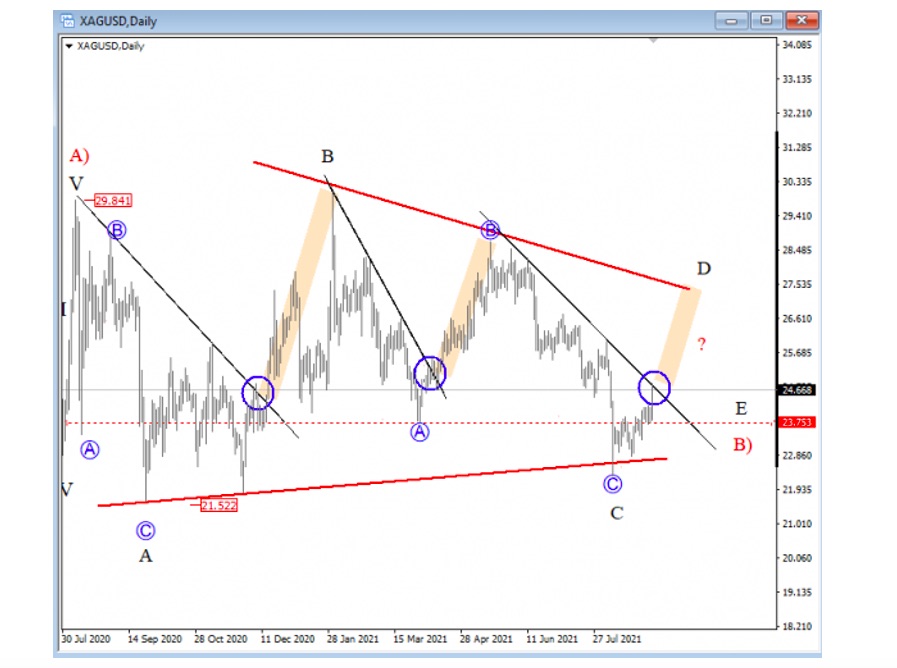
Silver is trying to recover from the lower triangle line after reaching potential wave “C” of C, so we have to be aware of a bigger rally for wave D back to the upper triangle line, especially if we see broken trendline. So, for now, bigger bullish and higher degree wave B) triangle can still be in progress.
Silver “daily” Elliott Wave Analysis Chart
Twitter: @GregaHorvatFX
The authors may have a position in the mentioned securities at the time of publication. Any opinions expressed herein are solely those of the author, and do not in any way represent the views or opinions of any other person or entity.


