Precious metals investors have enjoyed a great year for returns.
Heading into the final trading day of the year, Gold is up 15.7% and Silver is up 13.9%.
Not too shabby. But there appears to be more gains on the way… at least over the near term.
Traders received near-term breakout signals from both Gold and Silver recently. Gold broke out of it’s pullback / consolidation this past week and Silver broke out last week. This should bode well for both, along with gold and silver mining stocks. See charts below.
Note that the following MarketSmith charts are built with Investors Business Daily’s product suite.
I am an Investors Business Daily (IBD) partner and promote the use of their products. The entire platform offers a good mix of technical and fundamental data and education.
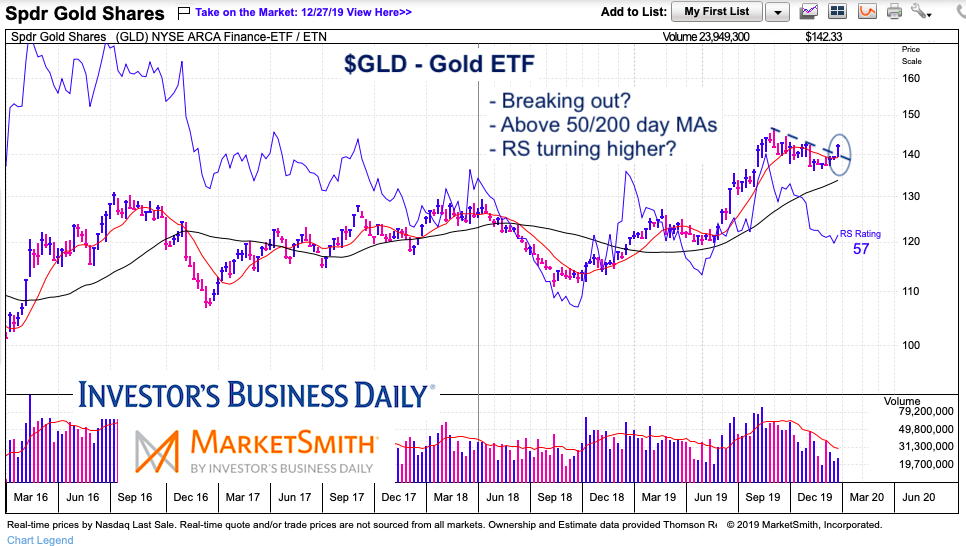
$GLD – Gold ETF Chart
Gold is above its 50/200 day moving averages, as well as its 10/40 week moving averages. Chart shows breakout of consolidation/downtrend with Relative Strength trying to reverse higher.
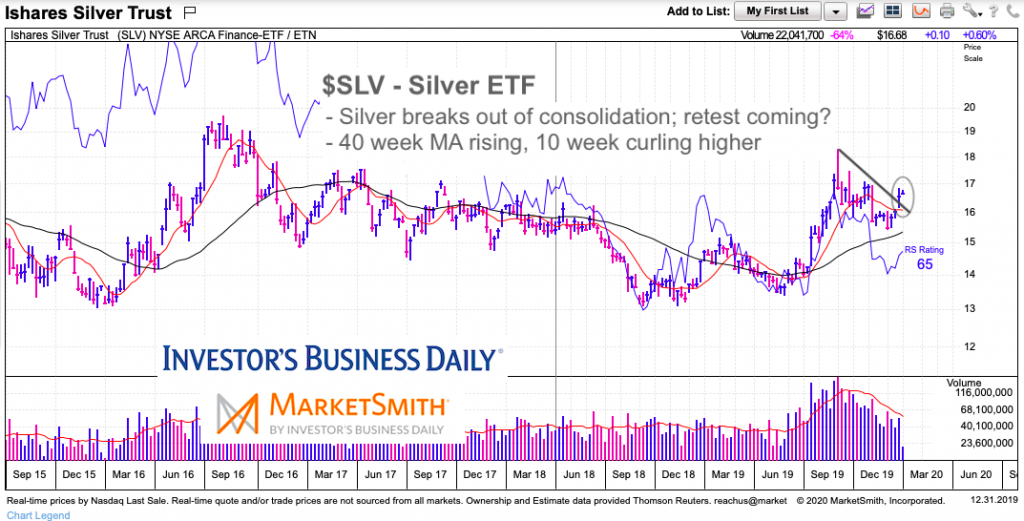
$SLV – Silver ETF Chart
Silver shows a very similar short-term situation, but perhaps has a bit more to prove intermediate term. Remember that silver is the higher beta (like small cap stocks) and when it leads, it’s a good sign. So precious metals investors want this chart to continue improving.
Twitter: @andrewnyquist
The author may have a position in mentioned securities at the time of publication. Any opinions expressed herein are solely those of the author, and do not in any way represent the views or opinions of any other person or entity.


