About $7 ago, I tweeted that Gilead Sciences stock (NASDAQ:GILD) was starting to present a real conundrum of fundamentals/valuation (positive) vs. technicals (negative). So far the technicals (and specifically DeMark indicators) have prevailed. But ignoring Gilead Sciences stock fundamentals (valuation and balance sheet) is becoming increasingly difficult.
If you are not familiar with the financials, the company has $2B in net cash ($24.6B gross) and is projected to generate $15B+ in Free Cash Flow each of the next 2 years.
That said, biotech traders/investors may find good risk/reward if they can marry the fundamentals with technicals. But that may may mean a short-term “trade” opportunity (for traders) and a lot of patience for investors. Below is my updated read of the DeMark technicals.
On a daily basis GILD is about to reach TD Propulsion Exhaustion Down target at $72.25 and is on bar 11 of a TD Sequential Countdown Buy. Put together, these two indicators suggest a bottom may be near. BUT on a weekly basis, the chart has just started a Buy Setup, and the price is below the broken/qualified TDST Level Down (i.e. the level where the trend changed). Because the TDST Level Down is broken on a qualified basis, we should presume an eventual completion of the Sequential Countdown Buy. And given that the chart is only on bar 2 of the Buy Setup, that would entail significantly more downside in price over an extended period of time. As well, the monthly chart is on bar 5 of a Buy Setup. TD oscillators are oversold on all time frames.
Sooo…how can one reasonably reconcile the fundamentals and the technicals? Here is a “bullish” possibility (please note this is my “creative” thinking/forecasting, not how DeMark signals are meant to be used): If the modestly bullish daily signals can stop the fall, and can cause the weekly Buy Setup to cancel, then I can see a scenario where the monthly Buy Setup cancels as well, or, it prints to completion as a function of time and not as a function of too much more price erosion. In non-DeMark “technical analysis” terms, we could see the beginning of basing process. There are bunch of moving parts in that scenario, but it’s about the only way I can make sense of the divergence between fundamentals and technicals.
I am long a small position, taking bites at $76 and $74. I plan on adding more at $72 and watching to see how the indicators play out.
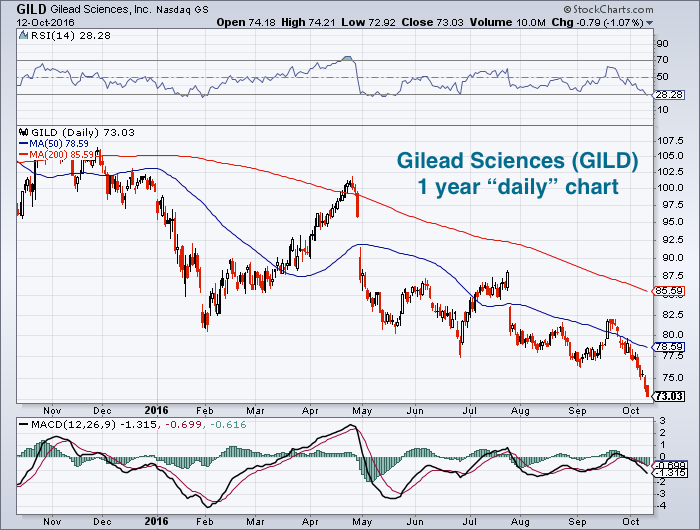
Below is a 1 year bar chart of Gilead Sciences stock price (for reference).
Thanks for reading and good trading to you.
Twitter: @FZucchi
The author is long GILD at the time of publication. Any opinions expressed herein are solely those of the author, and do not in any way represent the views or opinions of any other person or entity.


: Showing Some Signs of Emerging Strength")
