While there is no doubt that patience is a virtue for investors, exercising prudence is equally important. In our prior article “Limiting Losses”, we examined how taking prudent measures, at certain times, can enhance your ability to create wealth over the long-term for your clients. Despite basic math and historical evidence proving its usefulness, investors typically ignore prudence, especially when it is required most. The siren’s song of a rallying market inevitably proves too compelling for many investors. But today we’ll look at another warning: GDP trends and the latest economic growth data.
Dear Prudence: A Warning In Today’s GDP Data
On the heels of today’s first quarter GDP release we share our concern that the probability of a recession continues rising while stock prices remain at historically high valuations. Now may be a good time to heed history’s warnings. The focus of this article rests on one simple fact- recessions are not good for stock prices.
GDP Trends
In today’s GDP release the Bureau of Economic Analysis (BEA) reported 0.50% annualized economic growth, a sharp departure from the 1.40% annualized growth of the prior quarter. Economic growth is now running below a 1.00% annualized rate for the last two quarters and has been trending lower for the last two years as graphed below.
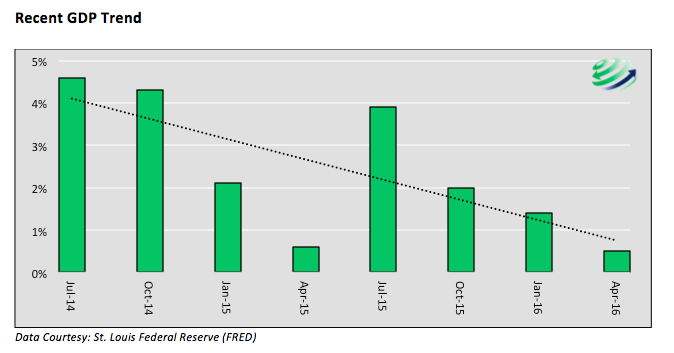
Economists consider this quarter an anomaly as judged by their forecasts for a rebound in the second quarter. The current consensus projection for the second quarter ending June 30, 2016, is 2.50%. Despite a secular trend of slowing domestic economic growth and global economic weakness, few economists are predicting a recession this year. Then again, few have ever correctly forecast a recession. Another reason why recent GDP trends are so concerning.
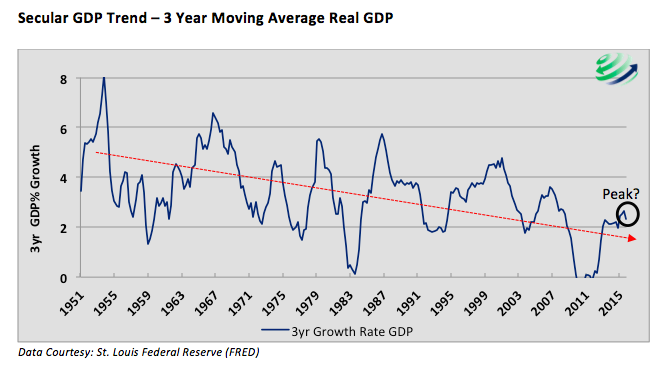
The graph below highlights the slowing secular trend in GDP growth and the series of cycles through which the U.S. economy tends to move. Note that five of the last seven economic cycles have progressively peaked at lower levels. If the current cycle peaked in mid-2015 (labeled “peak?”), a multi-year decline in GDP growth is likely. The average decline in economic growth from peak to trough for the seven cycles has been -4.3%, with -3.0% being the smallest decline. A 3.0% decrease from the current level of 2.3%, implies that the U.S. economy will have a three-year period averaging -0.7% growth.
If economists are correct and economic growth in the second quarter remains true to forecasts, the economy will avoid a recession in the first half of the year. That said, we must consider that while economists foresee a pickup in economic activity, relying on their forecasts is dangerous. On February 14, 2016, the Atlanta Federal Reserve was forecasting first quarter economic growth of 2.7%, and a consensus of economists expected 2.1% growth. Based on today’s GDP data, those forecasts were grossly off the mark, leaving one to question the integrity of second quarter forecasts. And as noted above, GDP trends are pointing lower.
Regardless of whether or not the first half of 2016 will be labeled a recession, one prudently should consider that the current period of economic growth, following the great financial crisis, is long in the tooth. The current economic expansion is now the second longest period of sustained economic growth in over 65 years. Suggesting that the economy is due for a recession is not an overstatement.
Valuations
Equity valuations are higher than average by many measures. In “A Bug in Search of a Windshield” we gave one example- “The current P/E is 55% above the historical mean and surpasses 92% of all P/E data. Only multiples from the 2000 and 2008 bubble periods were higher than today”. Doug Short created a simple model that averages four common equity valuation techniques. Based on his analysis, the market is 76% overvalued as compared to the average dating back to 1900. According to his analysis, current valuations are only surpassed by the exuberant markets leading into the depression of the 1930’s and the tech crash of the early 2000’s. Suggesting that equities are at lofty valuations and prices is not an overstatement.
GDP and Valuations
The possibility of a recession while equity valuations are extreme is deeply troubling. Since 1929, there have been 14 recessions. All but one, in 1945, coincided with a period of negative returns for stocks. Included in this data, as shown in the table below, are periods when stock valuations ranged from greatly undervalued to extremely overvalued. Data and Table Courtesy Doug Short
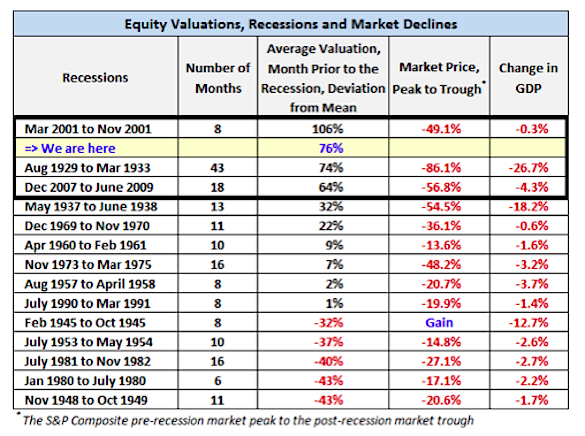
Most concerning to us are the top four rows. During these three historic periods and the current one, (“We are here”) valuations were/are extreme as shown in the middle column. The average stock market decline of the three historical periods was 62%. Based solely on historical data and current valuations versus the mean, a 50%+ drawdown would follow historical precedence. Suggesting that a severe drawdown could occur is not hyperbole or an overstatement.
Summary
This article provides more supporting evidence that the odds are stacked against equity investors. That does not mean the market cannot go higher and exhibit even greater speculative fervor. However, as fiduciaries, we must consider the long-term benefit of limiting drawdowns, especially when there is historical reason to believe they could be extreme. While it is not easy going against popular wisdom, we recommend exercising prudence and taking some chips off the table.
We end with an interesting fact. The current stock market is in the midst of the second longest bull market since the great depression, only surpassed in duration by the 4,495-day bullish run of the 1990’s.
Thanks for reading.
Twitter: @michaellebowitz
Author holds positions in related securities at the time of publication. Any opinions expressed herein are solely those of the author, and do not in any way represent the views or opinions of any other person or entity.


