At the start of this year, the GBP/USD currency pair was doing pretty well, going above the 1.3100 level. But then things changed as it started to go down.
This shift happened after it went up in five waves on the daily chart. Imagine it like a rollercoaster going up and then coming down.
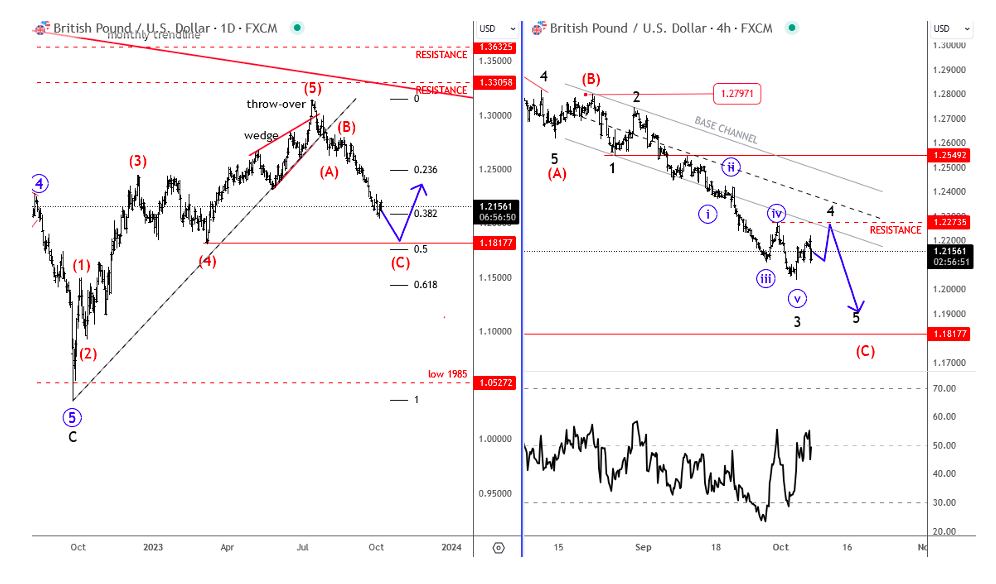
Also, there was a pattern that looked like an ending diagonal at the end of that upward move, which is a sign of a trend change. And further yet, an important trendline got broken in the process.
So, the drop we’re seeing now on GBP/USD is not a big surprise. It’s like a correction, a kind of pullback, but it’s happening quite quickly. This down part we’re in is called “wave C,” and it’s expected to be deeper and last longer than the initial drop. This is mostly because the Bank of England didn’t raise interest rates in September.
Right now, we’re keeping an eye on five smaller waves going down from a point called 1.2797. And there’s more of this downward movement to come after a temporary bounce in wave 4.
If you’re looking for levels to watch, there’s a point at 1.2273 where the price might find it harder to go above. But the really important level on the downside is 1.181; it’s the big support for this entire downward move.
Twitter: @GregaHorvatFX
The author may have a position in the mentioned securities at the time of publication. Any opinions expressed herein are solely those of the author, and do not in any way represent the views or opinions of any other person or entity.

: Worrisome to Broader Market?")
