Russell 2000 & Small Cap Stocks: Nothing Alarming Yet
The Russell 2000 ETF (NYSEARCA:IWM) and S&P Financial Sector ETF (NYSEARCA:XLF) rallied after the U.S. election based on expectations for reduced regulations under the Trump administration. But both have lagged in recent weeks.
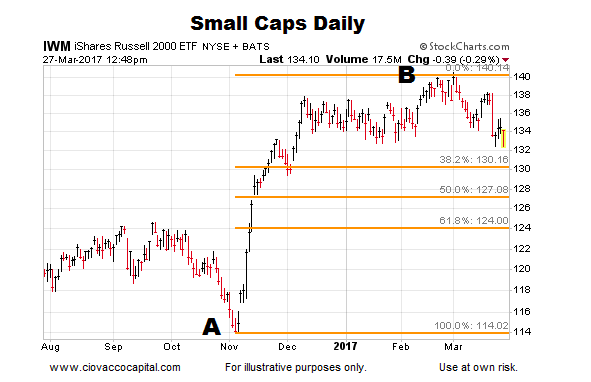
As shown in the chart below, the recent weakness in small caps (down to 132) still falls into the “normal pullback within the context of an ongoing and established bullish trend” category. Small caps, as of this writing, are roughly 2 percent higher and remain above all three major Fibonacci retracements (Fibs) based on the pre-election low (point A).
Russell 2000 ETF (IWM) Daily Chart
How Concerning Is The S&P 500’s Pullback?
In this week’s video covers a prudent and rational manner to monitor risk during inevitable “givebacks” or portfolio drawdowns. The S&P 500’s (NYSEARCA:SPY) present day profile is compared to the August 2015 pre-plunge profile, allowing us to better understand the odds of a similar waterfall decline following the tabling of the healthcare bill.
Are Financials/Banks On The Ropes?
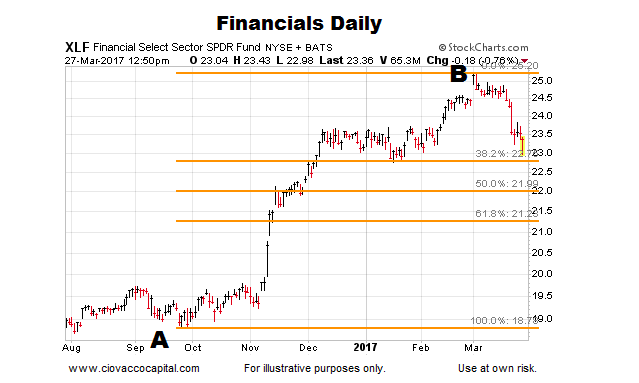
Like small caps, thus far, the pullback in financial stocks has remained above all three major Fibonacci retracements based on the pre-election low (point A). The XLF has rebounded another percent (as of this writing).
The odds of a longer-term bearish trend change would improve if XLF drops below the third major Fib near $21.25 (or roughly 10 percent below current levels).
Financial Sector ETF (XLF) Daily Chart
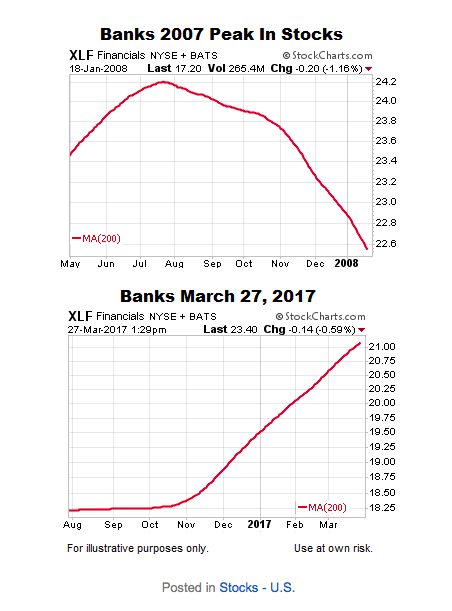
Banks: 2007 vs. 2017
The Fibonacci levels help us monitor the probability of the current bullish trends continuing relative to the odds of a new bearish trend developing. The slope of XLF’s 200-day moving average helps us monitor the strength of the long-term trend in banks/financial stocks. The top chart below shows the long-term trend rolling over in a bearish manner in 2007; the bottom chart shows the present day trend.
Thanks for reading.
Read more from Chris over on CCM.
Twitter: @CiovaccoCapital
The author or his clients may hold positions in mentioned securities at the time of publication. Any opinions expressed herein are solely those of the author, and do not in any way represent the views or opinions of any other person or entity.


